> ## Documentation Index
> Fetch the complete documentation index at: https://docs.simcel.io/llms.txt
> Use this file to discover all available pages before exploring further.
# P&L Waterfall
> Break down revenues and costs up to Constrained Net Sales In and compare variances across scenarios.
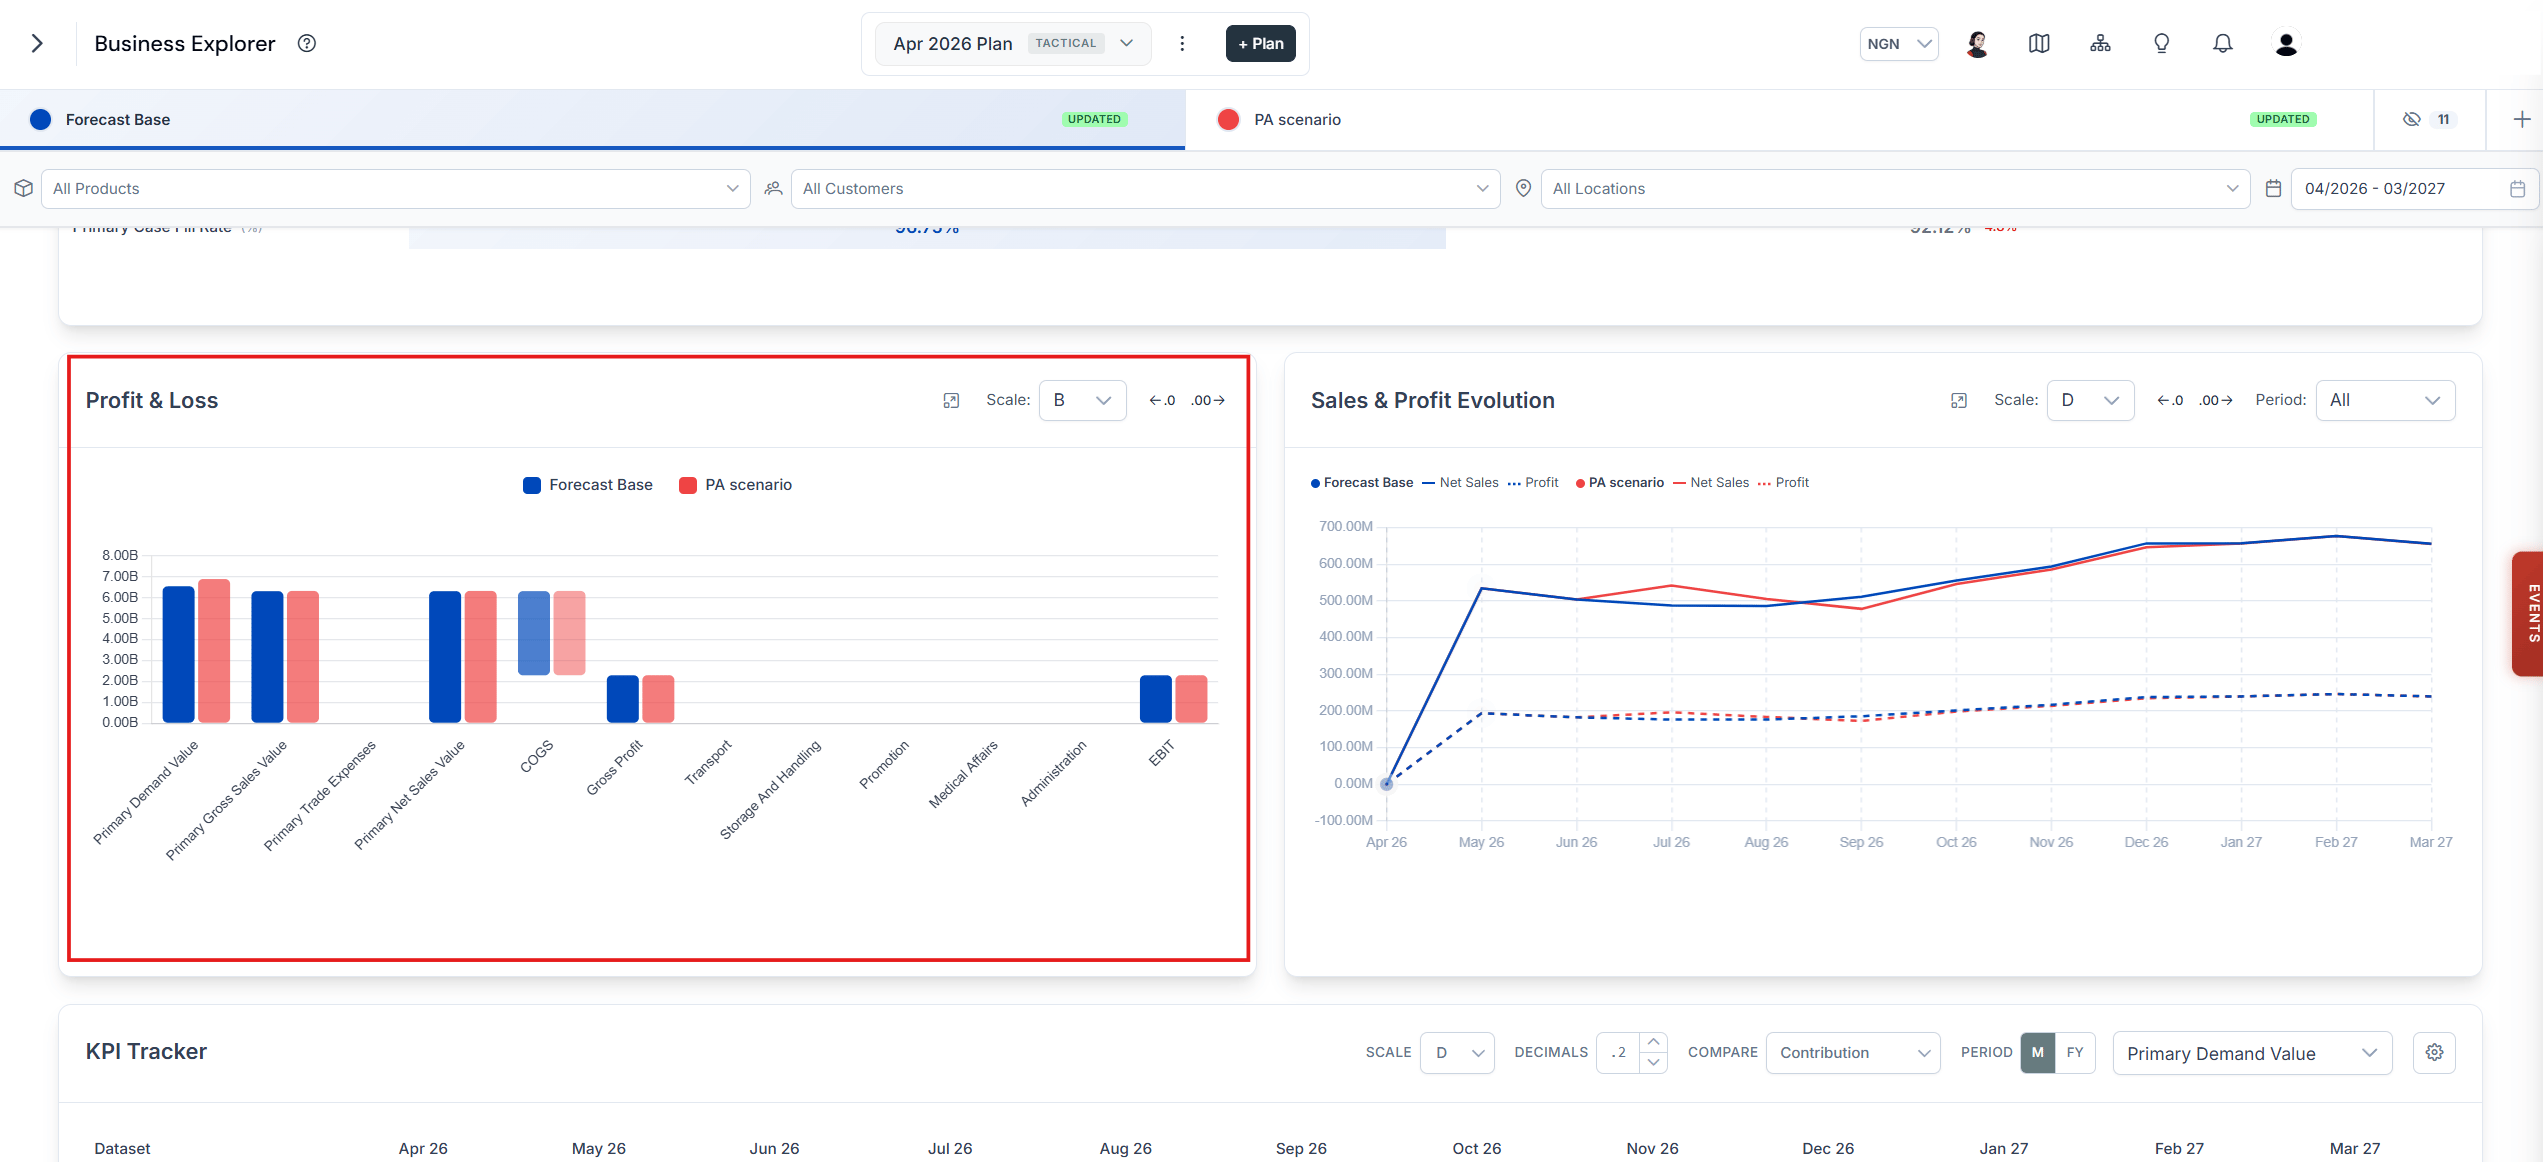
The **P\&L Waterfall** widget displays the different revenues and costs up to the **Constrained Net Sales In** in a waterfall format. It helps you with:
1. **Breakdown of components**: Shows the incremental effect of each component on the final net income.
2. **Visualizing contributions**: Distinguishes between positive contributions (revenues) and negative contributions (costs and expenses) to the overall financial outcome.
3. **Facilitating decision making**: Isolates and visualizes the impact of individual P\&L components.
4. **Performance comparison**: Compares various scenarios to identify variances.
 ## P\&L structure
SIMCEL cascades financial KPIs down this waterfall:
```text theme={null}
Primary Gross Sales Value (Constrained Sales In GSV)
- Primary Trade Expenses
= Primary Net Sales Value (Net FIE Sales)
- COGS (Distributor COGS)
= Gross Profit
- Transport
- Storage & Handling
= (Supply Chain Cost)
- Promotion
- Medical Affairs
= D-P-M (Distribution, Promotion & Medical)
- Administration
= D-P-M-A
= EBIT (Earnings Before Interest & Tax)
```
See [KPI Table](/business-explorer/kpi-table) for the formula behind each line.
## Scenario comparison
The Business Explorer highlights differences between scenarios using color coding:
* **Green** — favorable movement (higher revenue, lower costs)
* **Red** — unfavorable movement (lower revenue, higher costs)
```text theme={null}
% Difference = ((Scenario Value - Active Scenario Value) / |Active Scenario Value|) x 100
```
## Full screen view
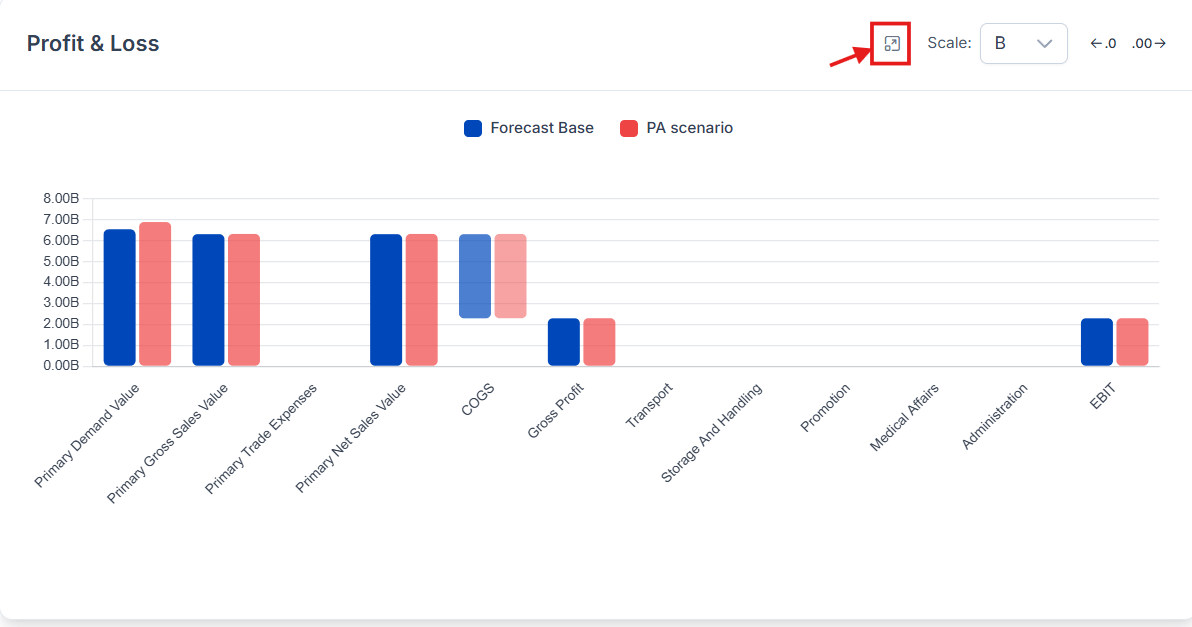
To enable the full screen view for this widget, click the full screen button.
## P\&L structure
SIMCEL cascades financial KPIs down this waterfall:
```text theme={null}
Primary Gross Sales Value (Constrained Sales In GSV)
- Primary Trade Expenses
= Primary Net Sales Value (Net FIE Sales)
- COGS (Distributor COGS)
= Gross Profit
- Transport
- Storage & Handling
= (Supply Chain Cost)
- Promotion
- Medical Affairs
= D-P-M (Distribution, Promotion & Medical)
- Administration
= D-P-M-A
= EBIT (Earnings Before Interest & Tax)
```
See [KPI Table](/business-explorer/kpi-table) for the formula behind each line.
## Scenario comparison
The Business Explorer highlights differences between scenarios using color coding:
* **Green** — favorable movement (higher revenue, lower costs)
* **Red** — unfavorable movement (lower revenue, higher costs)
```text theme={null}
% Difference = ((Scenario Value - Active Scenario Value) / |Active Scenario Value|) x 100
```
## Full screen view
To enable the full screen view for this widget, click the full screen button.