> ## Documentation Index
> Fetch the complete documentation index at: https://docs.simcel.io/llms.txt
> Use this file to discover all available pages before exploring further.
# Planning Accuracy
> Measure forecast precision
## Page navigation
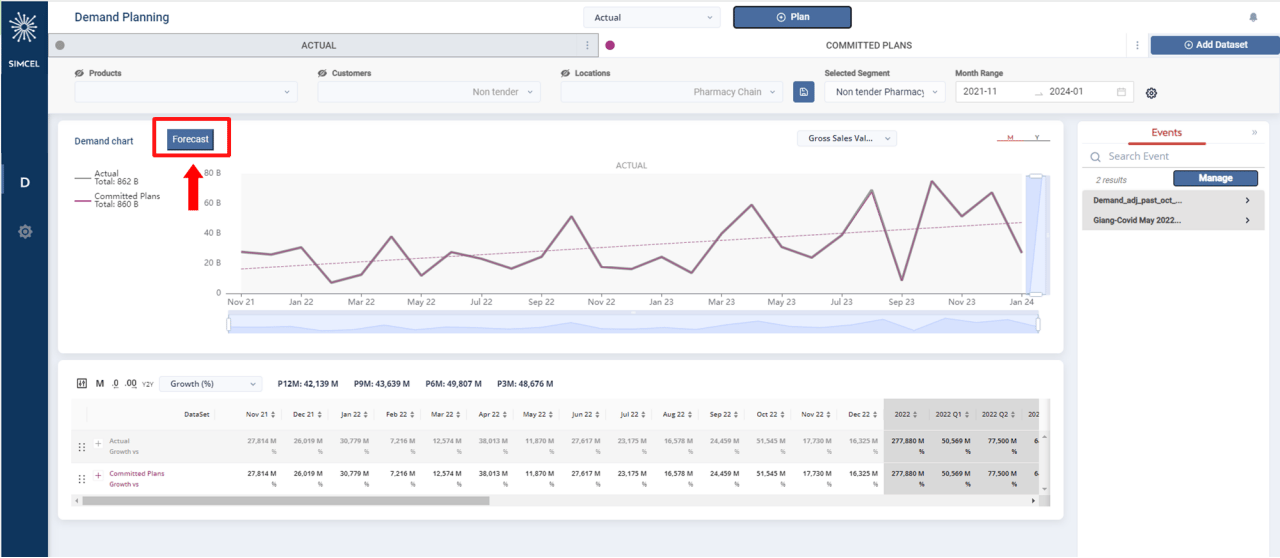
To access the **Demand Planning Accuracy** screen, click the **Forecast** button.
 This opens the **Demand Planning Accuracy** page, which lets you evaluate the performance of both your **Forecast** and your **Plan**.
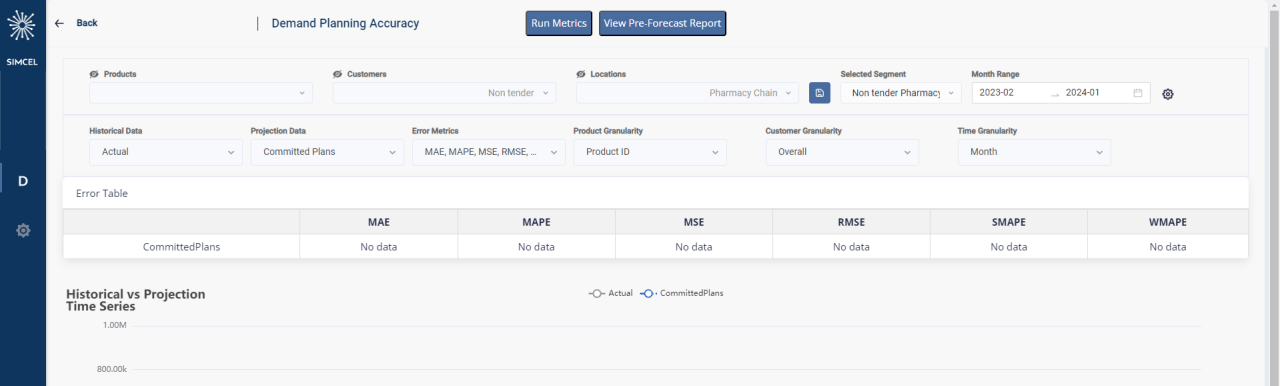 Besides the traditional filter controls, **Demand Planning Accuracy** gives you control over the data you visualize.
## Data selection
The **Historical Data** selector gives you access to 2 types of datasets.
Besides the traditional filter controls, **Demand Planning Accuracy** gives you control over the data you visualize.
## Data selection
The **Historical Data** selector gives you access to 2 types of datasets.
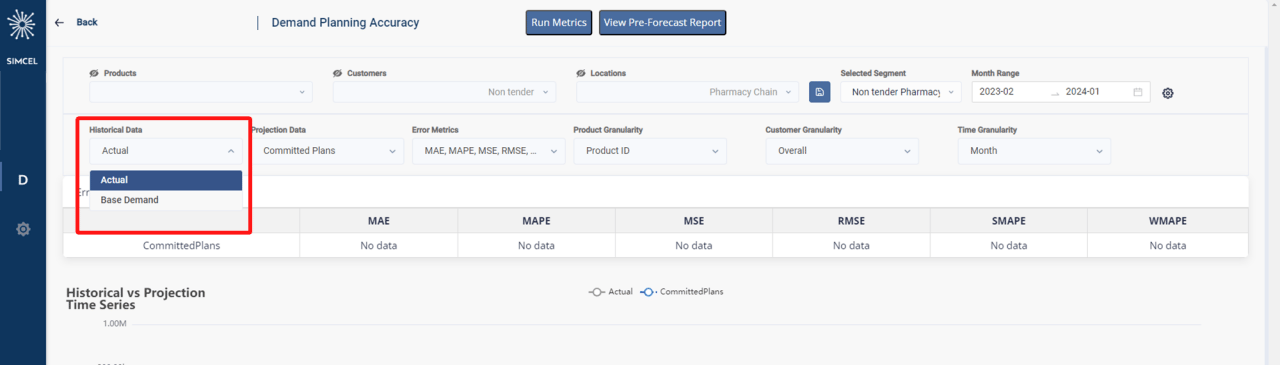 * **Actual** - The historical **Sales Out** data uploaded into SIMCEL.
* **Base Demand** - The historical **Sales Out** data cleaned up of any planned and unplanned demand events.
The **Projection Data** selector gives you access to 4 types of datasets.
* **Actual** - The historical **Sales Out** data uploaded into SIMCEL.
* **Base Demand** - The historical **Sales Out** data cleaned up of any planned and unplanned demand events.
The **Projection Data** selector gives you access to 4 types of datasets.
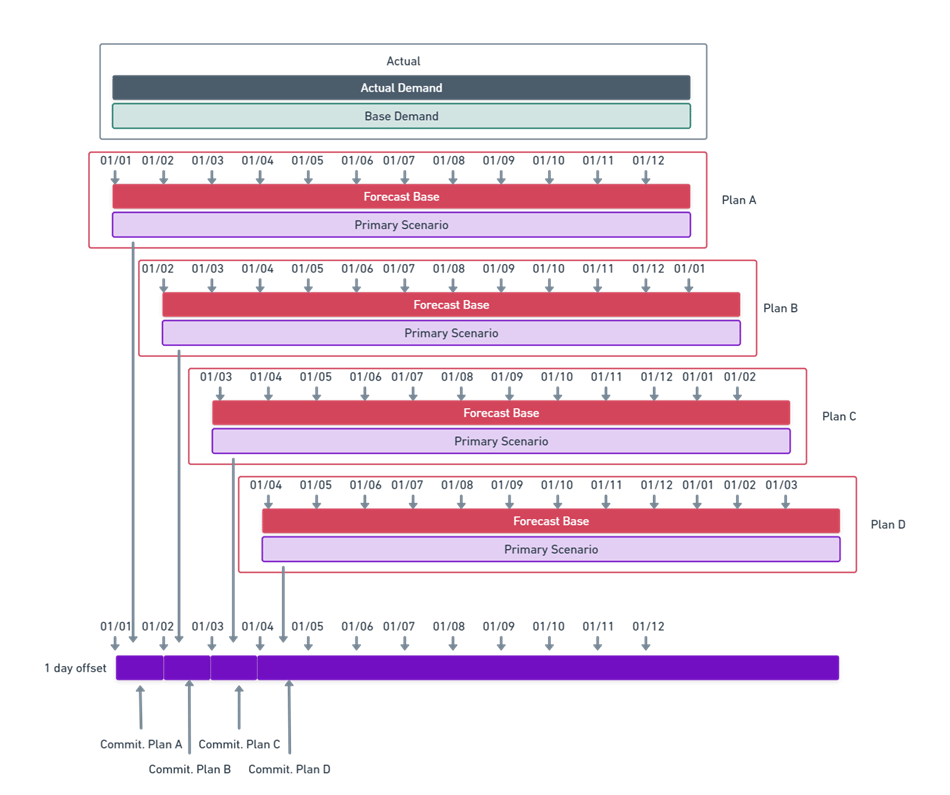
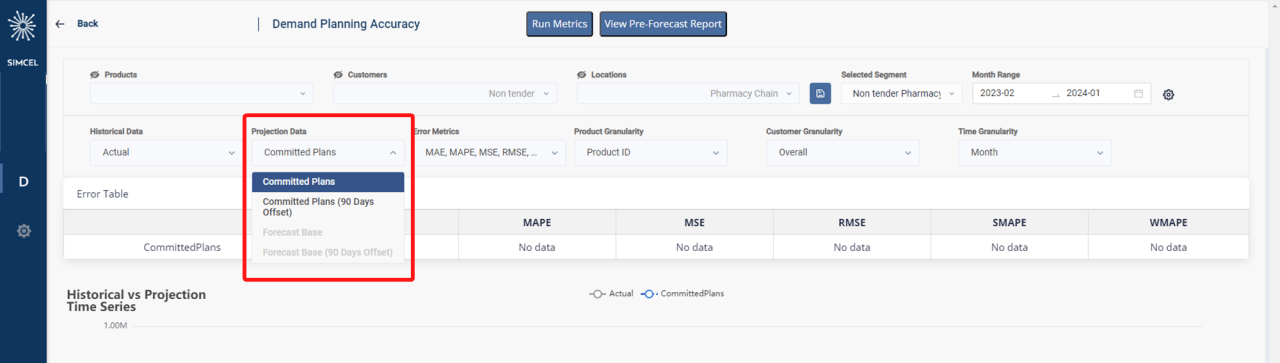 * **Committed Plans** - The consolidation of all past plans set as primary (validated for execution), which include the trade and marketing events and their impacts, with an offset of 1 day.
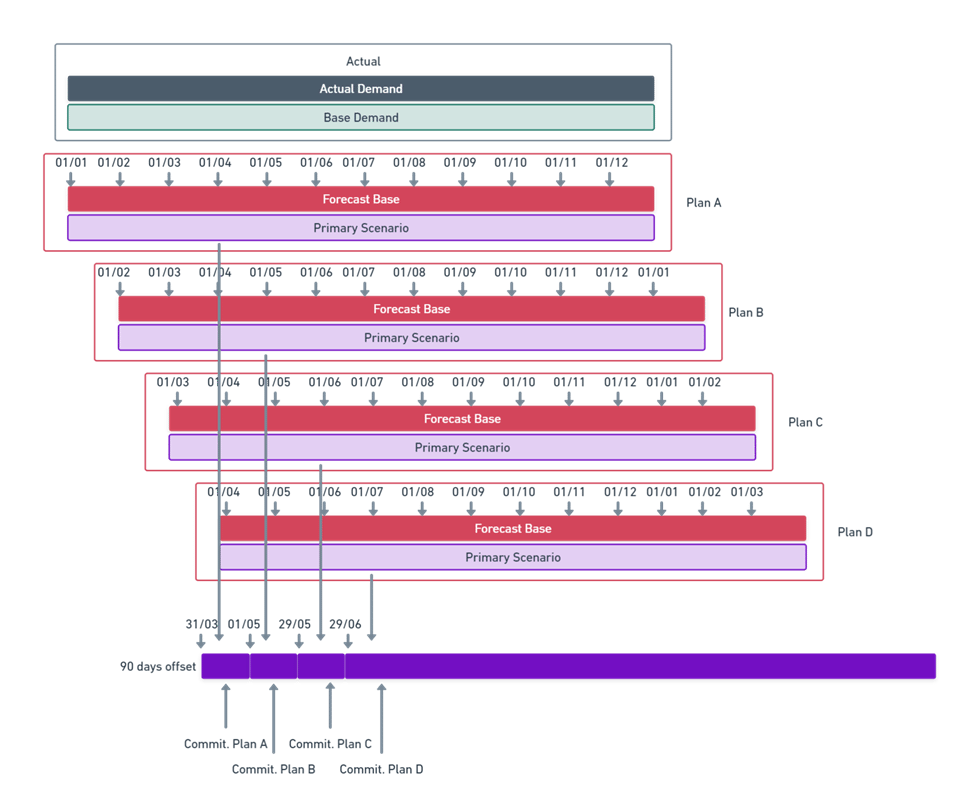
 * **Committed Plans (90 Days Offset)** - The consolidation of all past plans set as primary (validated for execution), which include the trade and marketing events and their impacts, with an offset of 90 days (lag 3).
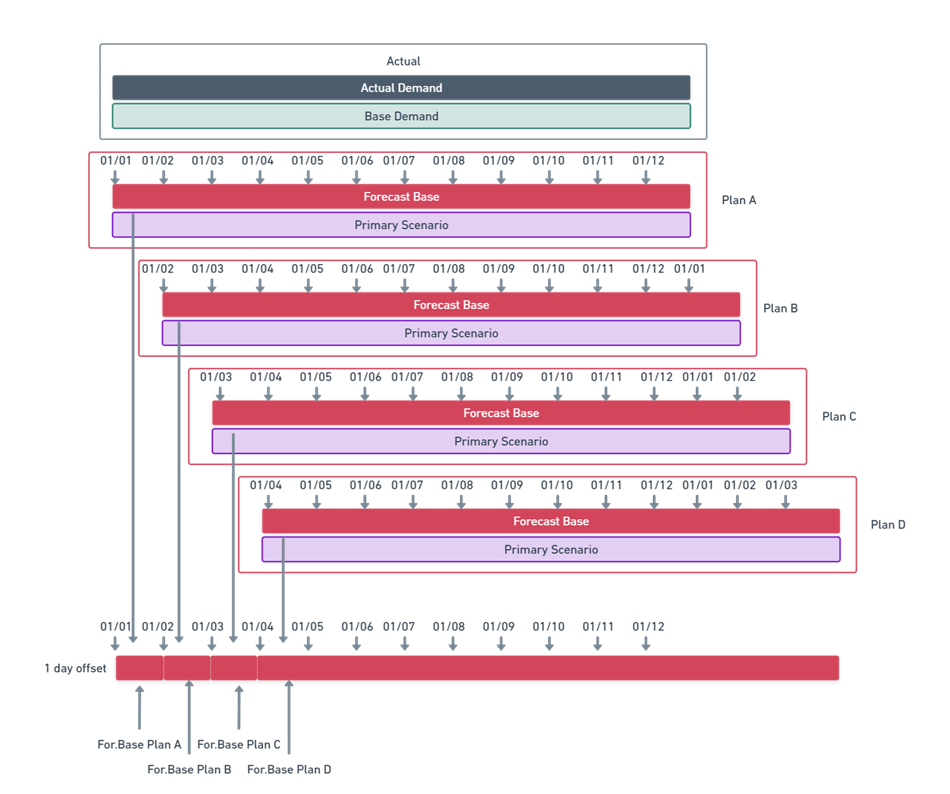
 * **Forecast Base** - The consolidation of all past forecast baselines, which do not include trade and marketing events, with an offset of 1 day.
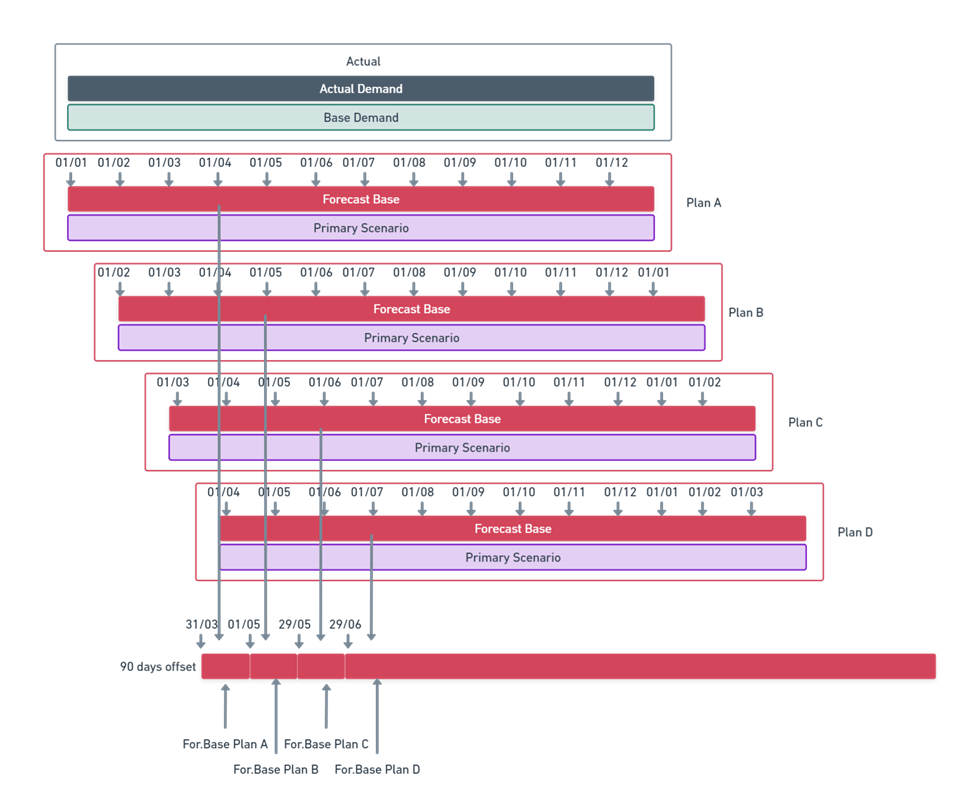
 * **Forecast Base (90 Days Offset)** - The consolidation of all past forecast baselines, which do not include trade and marketing events, with an offset of 90 days (lag 3).
 Historical data is always compared against projection data:
* **Actual** vs **Committed Plans** (or **Committed Plans (90 Days Offset)**) - Compare planning accuracy, including any trade and marketing events.
* **Base Demand** vs **Forecast Base** (or **Forecast Base (90 Days Offset)**) - Compare statistical forecast accuracy, excluding any trade and marketing events.
## Error metrics
The **Error Metrics** selector gives access to the accuracy performance metrics.
Historical data is always compared against projection data:
* **Actual** vs **Committed Plans** (or **Committed Plans (90 Days Offset)**) - Compare planning accuracy, including any trade and marketing events.
* **Base Demand** vs **Forecast Base** (or **Forecast Base (90 Days Offset)**) - Compare statistical forecast accuracy, excluding any trade and marketing events.
## Error metrics
The **Error Metrics** selector gives access to the accuracy performance metrics.
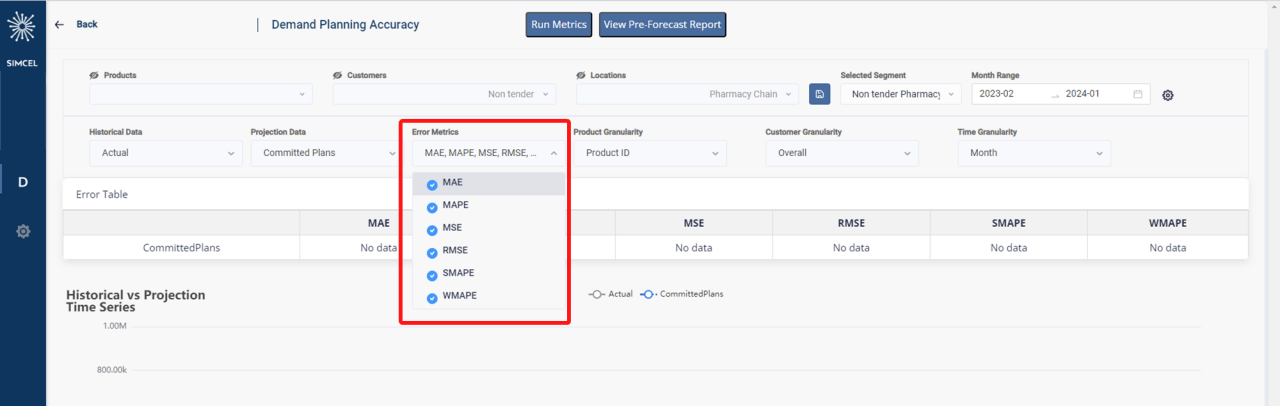 SIMCEL uses 6 different metrics. You'll find the definition of each in the appendix.
* **MAE** - Mean Absolute Error
* **MAPE** - Mean Absolute Percentage Error
* **MSE** - Mean Square Error
* **RMSE** - Root Mean Square Error
* **SMAPE** - Symmetric Mean Absolute Percentage Error
* **WMAPE** - Weighted Mean Absolute Percentage Error
## Data granularity
The **Product Granularity** selector sets the level at which product data is aggregated before the error metrics are computed.
SIMCEL uses 6 different metrics. You'll find the definition of each in the appendix.
* **MAE** - Mean Absolute Error
* **MAPE** - Mean Absolute Percentage Error
* **MSE** - Mean Square Error
* **RMSE** - Root Mean Square Error
* **SMAPE** - Symmetric Mean Absolute Percentage Error
* **WMAPE** - Weighted Mean Absolute Percentage Error
## Data granularity
The **Product Granularity** selector sets the level at which product data is aggregated before the error metrics are computed.
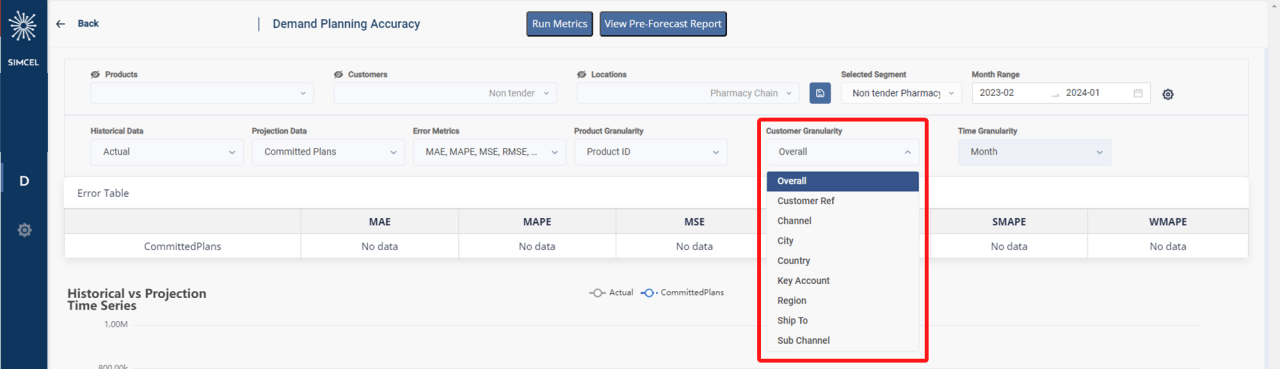
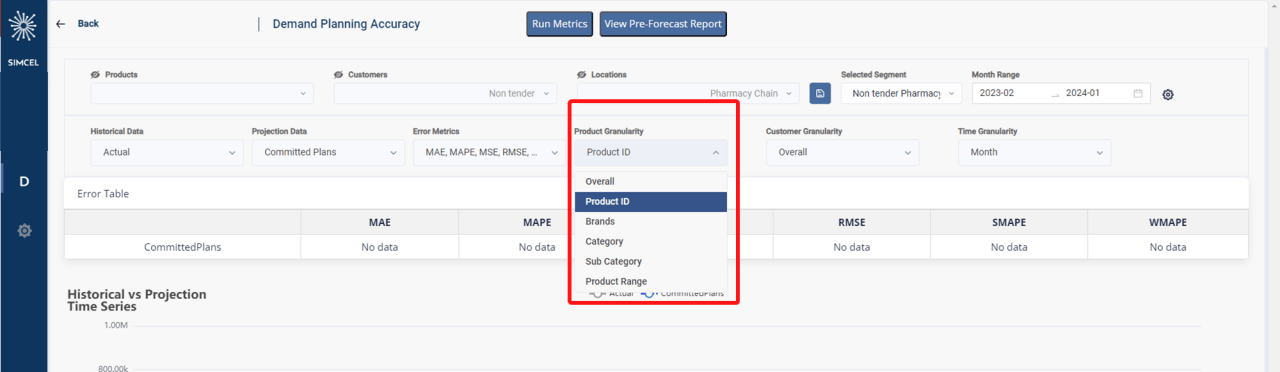 The **Customer Granularity** selector sets the level at which customer data is aggregated before the error metrics are computed.
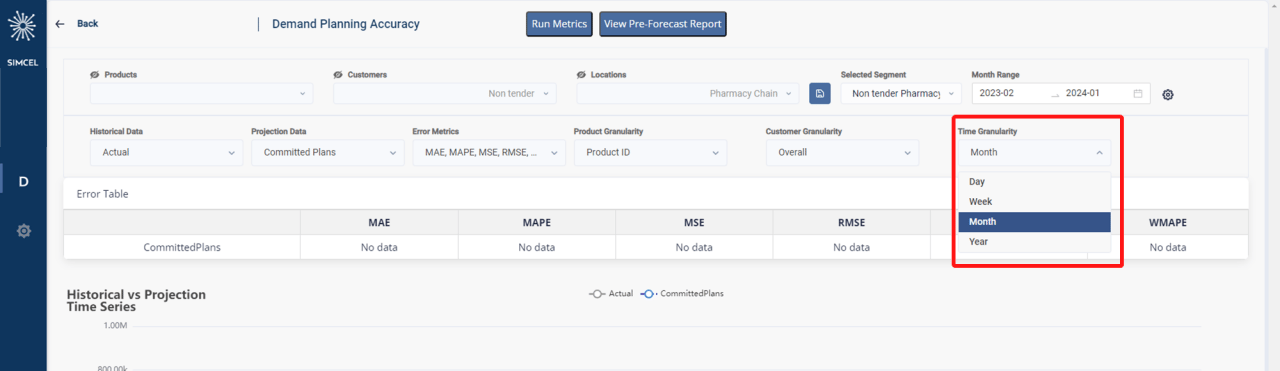
 The **Time Granularity** selector sets the level at which the time dimension is aggregated before the error metrics are computed.
 ## Analytics
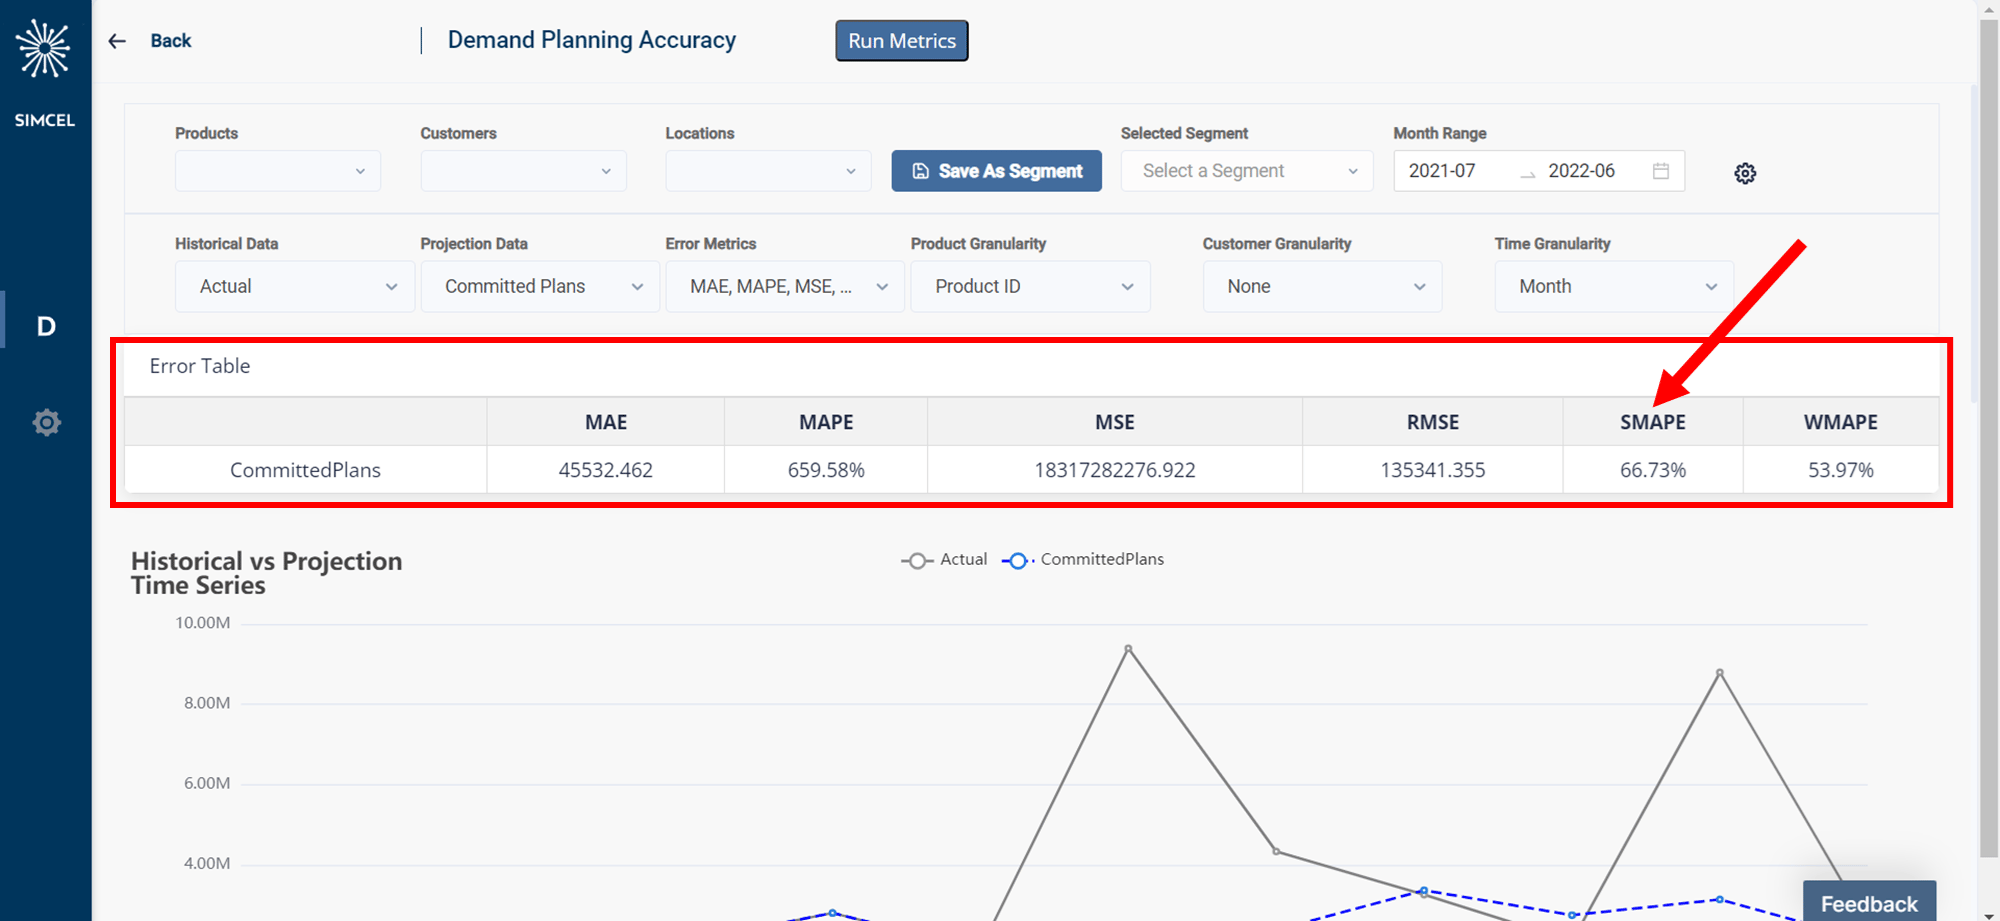
The **Error Metrics** widget gives a summary of the projection accuracy based on the error metrics you selected. The data is affected by the filters and aggregation levels you chose. As a rule of thumb, the more atomic the data, the less accurate the projection.
## Analytics
The **Error Metrics** widget gives a summary of the projection accuracy based on the error metrics you selected. The data is affected by the filters and aggregation levels you chose. As a rule of thumb, the more atomic the data, the less accurate the projection.
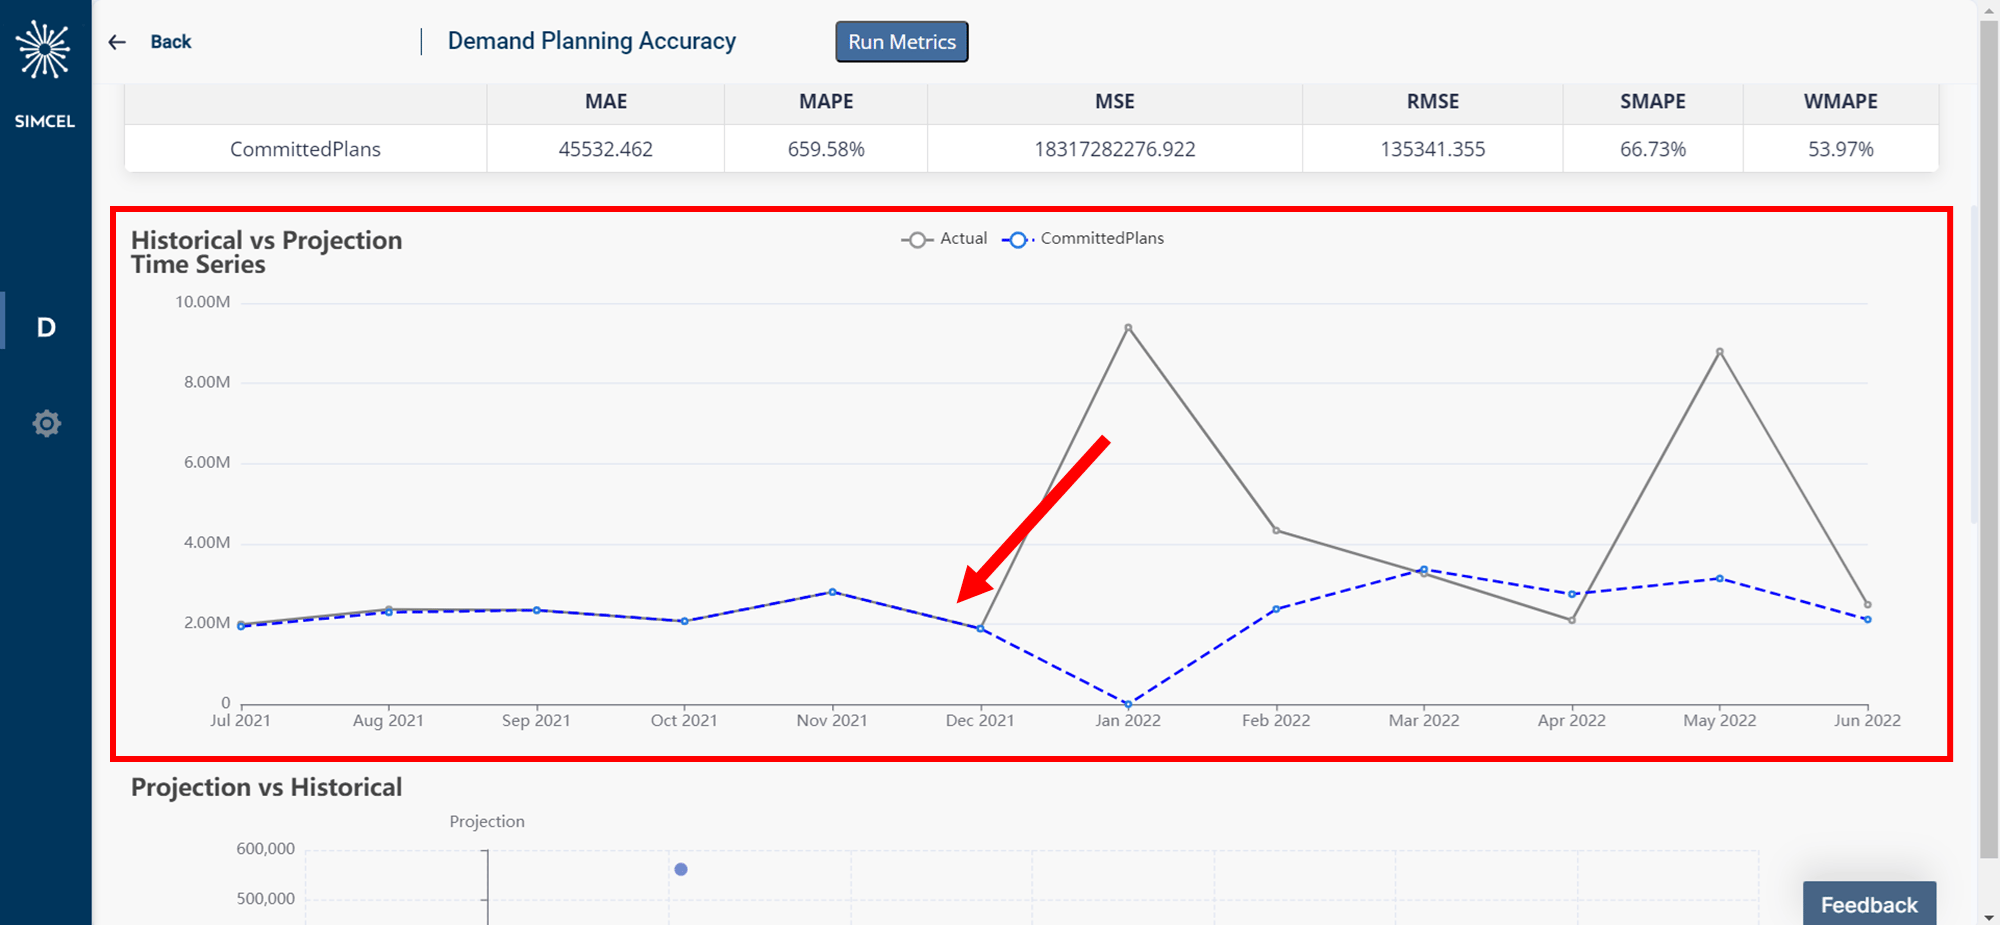
 The **Historical VS Projection Time Series** widget displays the historical data and the projection data in the same line chart, letting you spot the periods where the two datasets deviate.
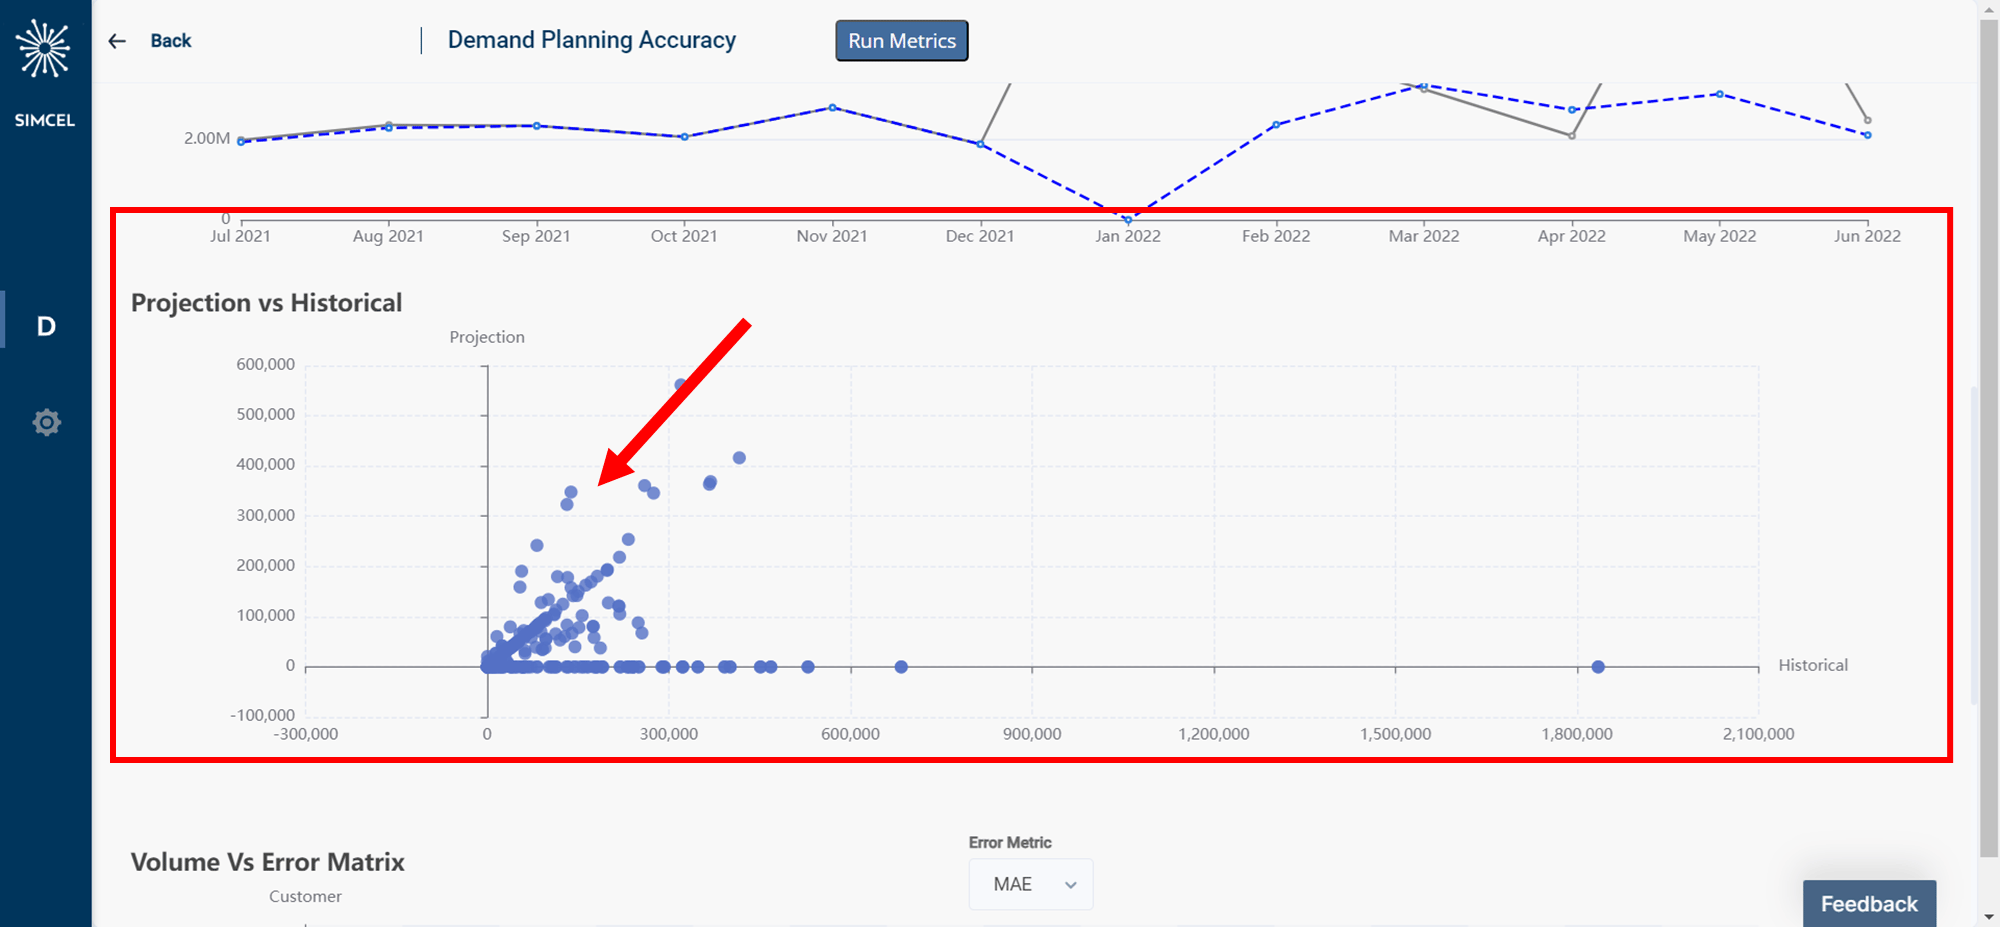
 The **Historical VS Projection** widget displays all data points according to the aggregation level and lets you assess the discrepancies of over- and under-forecasting.
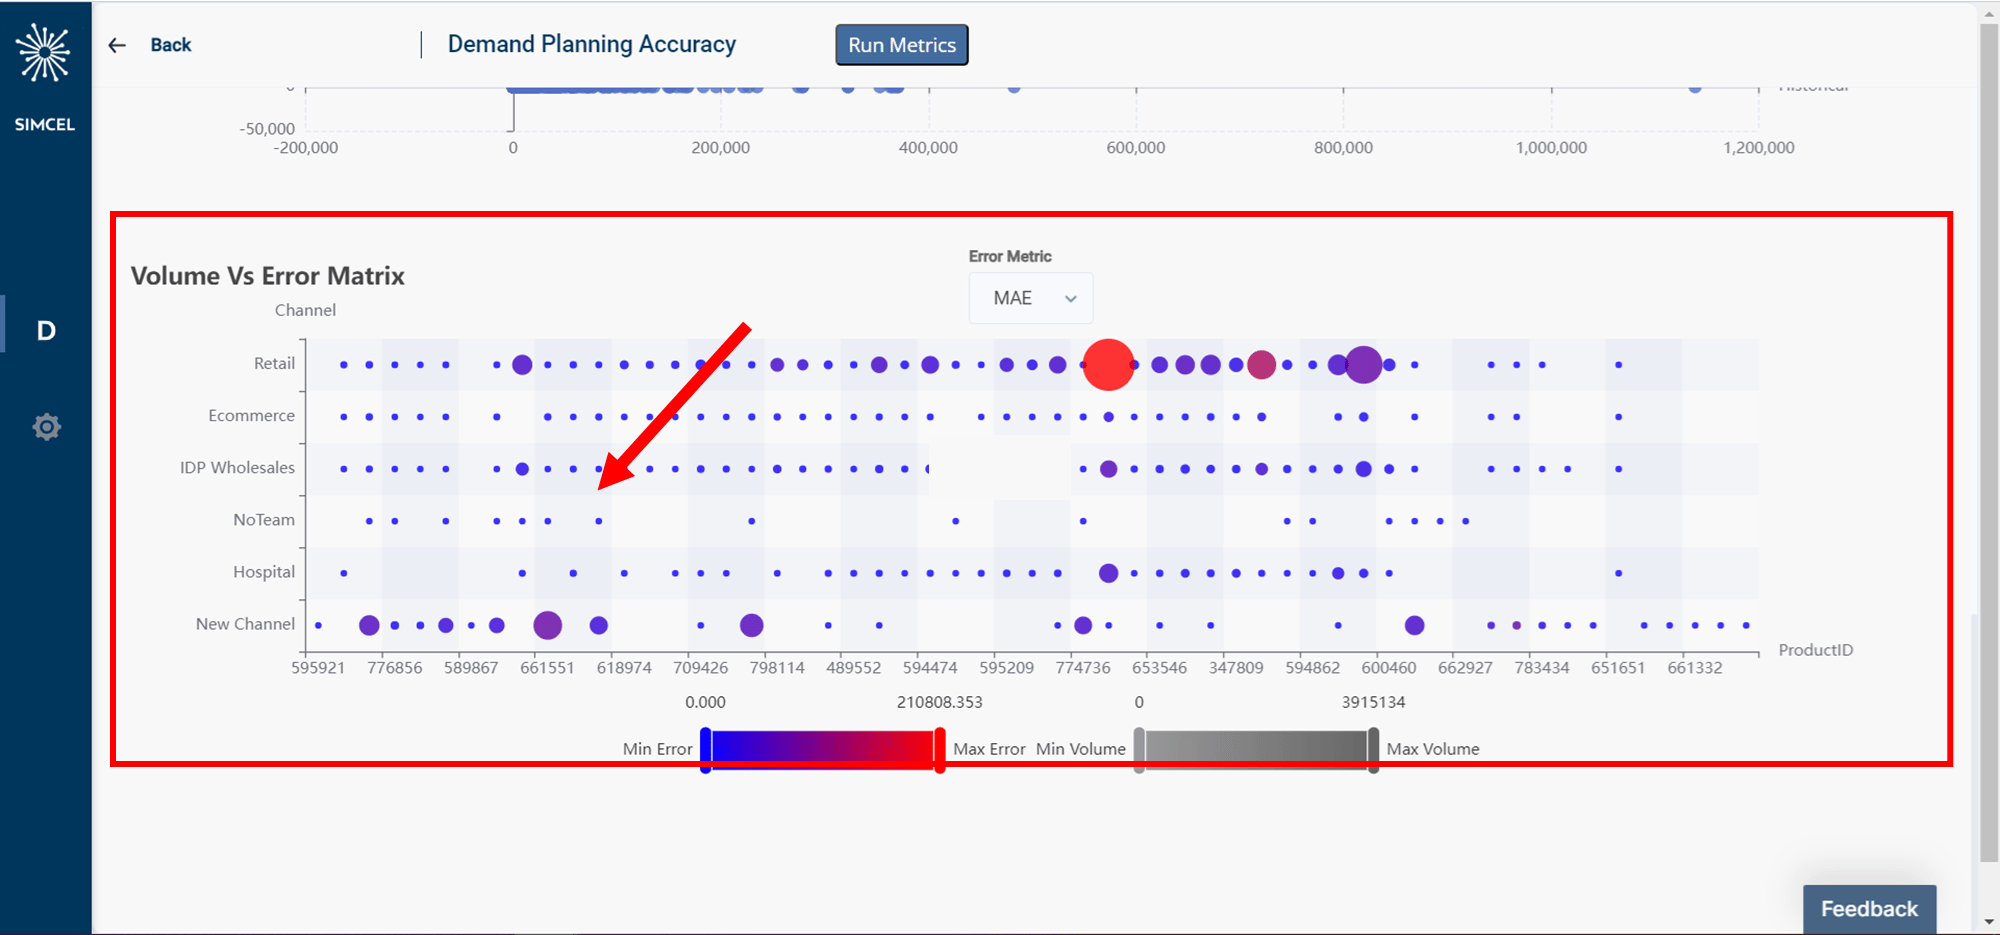
 The **Volume Vs Error Matrix** widget displays the accuracy and the volume of each customer and product segment. Use it to identify the best and worst performers.
 ## Metrics computation
The Demand Planning Accuracy table is not updated automatically.
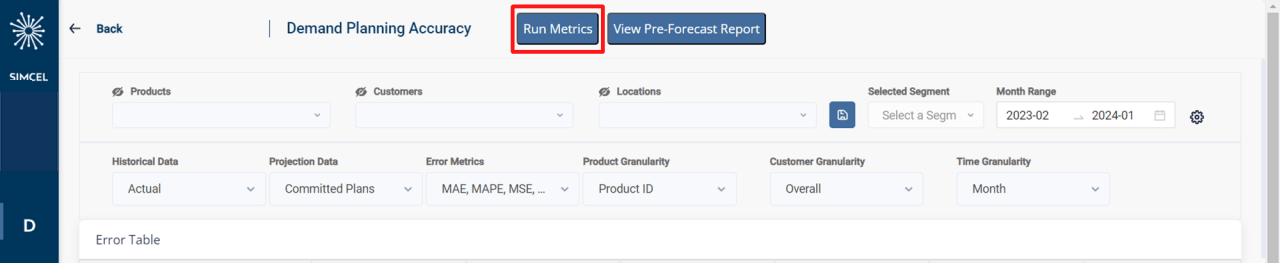
If the historical data changes (new data uploaded, base demand adjusted) or the projection data changes (forecast updated, new event allocated to the primary scenario, new primary scenario), click **Run Metrics** to ensure all the analytics display the latest data.
## Metrics computation
The Demand Planning Accuracy table is not updated automatically.
If the historical data changes (new data uploaded, base demand adjusted) or the projection data changes (forecast updated, new event allocated to the primary scenario, new primary scenario), click **Run Metrics** to ensure all the analytics display the latest data.
 ## Export the demand dynamic report
The Demand Dynamic Report, authored by SIMCEL, analyzes product historical sales performance. The report provides insights into overall demand trends, key contributors, and significant outliers.
To export the report:
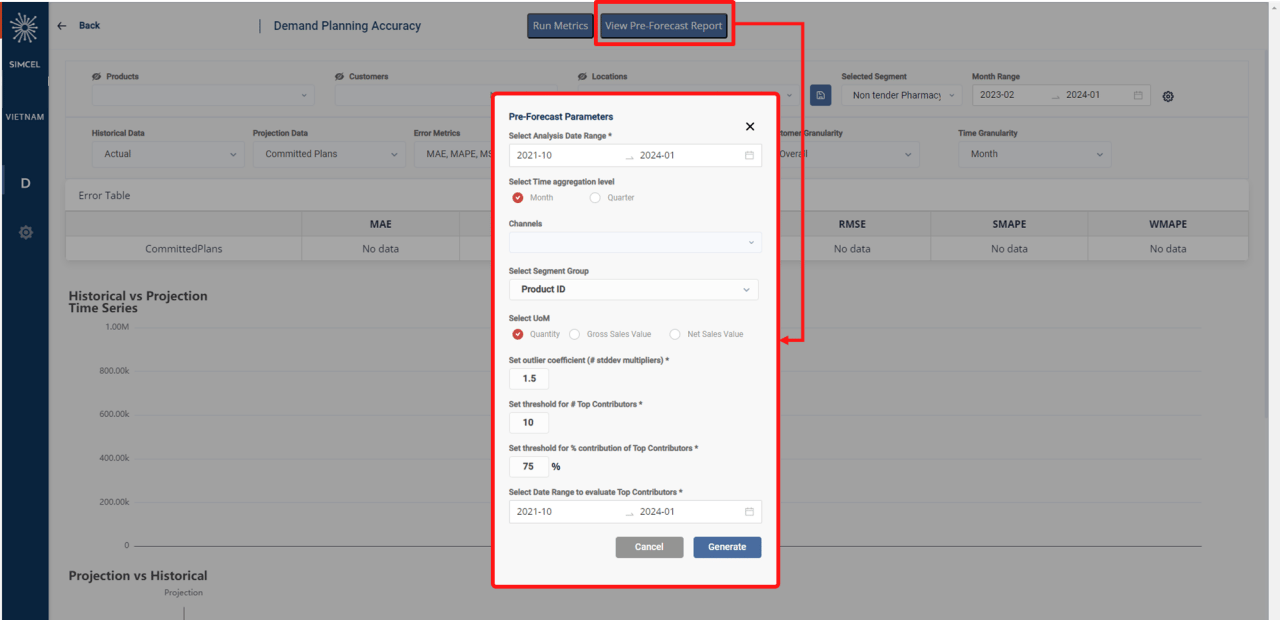
Click **View Pre-Forecast Report**.
Set the meta information of the report:
* **Select Analysis Date Range** - Choose the period for the report analysis.
* **Select Time aggregation level** - Select how you want to aggregate time data (monthly, quarterly).
* **Channels (optional)** - Define a subset of customer segments.
* **Select Segment Group** - Choose the aggregation level for historical demand and forecast data, such as brand, category, or channel.
* **Select UoM** - Specify the unit of measurement for analyzing historical demand and forecast data.
* **Set outlier coefficient (# stddev multipliers)** - Set the number of standard deviation multipliers for outlier detection and analysis. This helps identify significantly high or low sales volumes during the selected period (see the [68-95-99.7 rule](https://en.wikipedia.org/wiki/68%E2%80%9395%E2%80%9399.7_rule)).
* **Set threshold for # Top Contributors** - Establish the number of top contributing segments (for example, brands or product IDs) to highlight in the report. This is the absolute threshold.
* **Set threshold for % contribution of Top Contributors** - Define the percentage threshold that identifies top contributors by their share of total demand, sales volume, and so on. If the number of contributors exceeding this percentage surpasses the absolute threshold, it is adjusted to match the absolute threshold limit.
* **Select Date Range to evaluate Top Contributors** - Select the time frame for identifying top contributors, based on their contribution to sales or demand within the last year or another defined period. For example, you may only care about brands that make up 80% of sales in the last 12 months.
Click **Generate**. An HTML report is automatically saved to your computer.
## Export the demand dynamic report
The Demand Dynamic Report, authored by SIMCEL, analyzes product historical sales performance. The report provides insights into overall demand trends, key contributors, and significant outliers.
To export the report:
Click **View Pre-Forecast Report**.
Set the meta information of the report:
* **Select Analysis Date Range** - Choose the period for the report analysis.
* **Select Time aggregation level** - Select how you want to aggregate time data (monthly, quarterly).
* **Channels (optional)** - Define a subset of customer segments.
* **Select Segment Group** - Choose the aggregation level for historical demand and forecast data, such as brand, category, or channel.
* **Select UoM** - Specify the unit of measurement for analyzing historical demand and forecast data.
* **Set outlier coefficient (# stddev multipliers)** - Set the number of standard deviation multipliers for outlier detection and analysis. This helps identify significantly high or low sales volumes during the selected period (see the [68-95-99.7 rule](https://en.wikipedia.org/wiki/68%E2%80%9395%E2%80%9399.7_rule)).
* **Set threshold for # Top Contributors** - Establish the number of top contributing segments (for example, brands or product IDs) to highlight in the report. This is the absolute threshold.
* **Set threshold for % contribution of Top Contributors** - Define the percentage threshold that identifies top contributors by their share of total demand, sales volume, and so on. If the number of contributors exceeding this percentage surpasses the absolute threshold, it is adjusted to match the absolute threshold limit.
* **Select Date Range to evaluate Top Contributors** - Select the time frame for identifying top contributors, based on their contribution to sales or demand within the last year or another defined period. For example, you may only care about brands that make up 80% of sales in the last 12 months.
Click **Generate**. An HTML report is automatically saved to your computer.
 ## Appendix: forecast KPI definitions
### Error
The error is the forecast minus the demand.
```text theme={null}
e_t = f_t - d_t
```
With this definition, if the forecast overshoots the demand the error is positive, and if the forecast undershoots the demand the error is negative.
### Bias
The bias is the average error.
```text theme={null}
bias = (1 / n) * Σ (f_t - d_t)
```
Where *n* is the number of historical periods where you have both a forecast and a demand.
Because a positive error on one item can offset a negative error on another item, a forecast model can achieve very low bias and still not be precise.
### MAPE
MAPE is the sum of the individual absolute errors divided by the demand, each period separately. It is the average of the percentage errors.
```text theme={null}
MAPE = (1 / n) * Σ ( |e_t| / d_t )
```
MAPE is a poor accuracy indicator. Because it divides each error individually by the demand, it is skewed: high errors during low-demand periods have a major impact on MAPE.
### MAE
MAE is the mean of the absolute error.
```text theme={null}
MAE = (1 / n) * Σ |e_t|
```
One issue with this KPI is that it is not scaled to the average demand. If someone tells you MAE is 10 for a particular item, you cannot know whether that is good or bad. If your average demand is 1000, it is excellent; if your average demand is 1, it is very poor accuracy. To solve this, it is common to divide MAE by the average demand to get a percentage:
```text theme={null}
MAE% = MAE / mean(d)
```
**MAPE/MAE confusion**: Many people call MAE "MAPE", which leads to misunderstandings. To avoid confusion and ensure accurate comparisons, always specify the error calculation method you used in any discussion or analysis.
### MSE
MSE is the average of the squares of the errors, where the error is the difference between the forecast and the actual demand.
```text theme={null}
MSE = (1 / n) * Σ (e_t)^2
```
Just as for MAE, MSE is not scaled to the demand. You can define MSE% as:
```text theme={null}
MSE% = MSE / mean(d)
```
### RMSE
RMSE is the square root of the mean squared error.
```text theme={null}
RMSE = sqrt( (1 / n) * Σ (e_t)^2 )
```
Just as for MAE, RMSE is not scaled to the demand. You can define RMSE% as:
```text theme={null}
RMSE% = RMSE / mean(d)
```
Compared to MAE, MSE and RMSE give more weight to larger errors. Larger forecast errors have a disproportionately larger impact on the MSE value, making it sensitive to outliers and large deviations.
### WMAPE
WMAPE is similar to MAPE but takes into account the importance of different periods or products by applying a weight. The weight assigned to each period or product reflects its relative importance to the total sales volume, demand, or any other weight that is critical to the business.
```text theme={null}
WMAPE = Σ ( w_t * |e_t| ) / Σ ( w_t * d_t )
```
### SMAPE
SMAPE is a measure of forecast accuracy that is symmetric around zero, meaning it penalizes over-forecasting and under-forecasting equally. It is the average absolute percentage error between the actual and forecasted values, divided by the average of the actual and forecasted values.
```text theme={null}
SMAPE = (1 / n) * Σ ( |f_t - d_t| / ((|d_t| + |f_t|) / 2) )
```
## Appendix: forecast KPI definitions
### Error
The error is the forecast minus the demand.
```text theme={null}
e_t = f_t - d_t
```
With this definition, if the forecast overshoots the demand the error is positive, and if the forecast undershoots the demand the error is negative.
### Bias
The bias is the average error.
```text theme={null}
bias = (1 / n) * Σ (f_t - d_t)
```
Where *n* is the number of historical periods where you have both a forecast and a demand.
Because a positive error on one item can offset a negative error on another item, a forecast model can achieve very low bias and still not be precise.
### MAPE
MAPE is the sum of the individual absolute errors divided by the demand, each period separately. It is the average of the percentage errors.
```text theme={null}
MAPE = (1 / n) * Σ ( |e_t| / d_t )
```
MAPE is a poor accuracy indicator. Because it divides each error individually by the demand, it is skewed: high errors during low-demand periods have a major impact on MAPE.
### MAE
MAE is the mean of the absolute error.
```text theme={null}
MAE = (1 / n) * Σ |e_t|
```
One issue with this KPI is that it is not scaled to the average demand. If someone tells you MAE is 10 for a particular item, you cannot know whether that is good or bad. If your average demand is 1000, it is excellent; if your average demand is 1, it is very poor accuracy. To solve this, it is common to divide MAE by the average demand to get a percentage:
```text theme={null}
MAE% = MAE / mean(d)
```
**MAPE/MAE confusion**: Many people call MAE "MAPE", which leads to misunderstandings. To avoid confusion and ensure accurate comparisons, always specify the error calculation method you used in any discussion or analysis.
### MSE
MSE is the average of the squares of the errors, where the error is the difference between the forecast and the actual demand.
```text theme={null}
MSE = (1 / n) * Σ (e_t)^2
```
Just as for MAE, MSE is not scaled to the demand. You can define MSE% as:
```text theme={null}
MSE% = MSE / mean(d)
```
### RMSE
RMSE is the square root of the mean squared error.
```text theme={null}
RMSE = sqrt( (1 / n) * Σ (e_t)^2 )
```
Just as for MAE, RMSE is not scaled to the demand. You can define RMSE% as:
```text theme={null}
RMSE% = RMSE / mean(d)
```
Compared to MAE, MSE and RMSE give more weight to larger errors. Larger forecast errors have a disproportionately larger impact on the MSE value, making it sensitive to outliers and large deviations.
### WMAPE
WMAPE is similar to MAPE but takes into account the importance of different periods or products by applying a weight. The weight assigned to each period or product reflects its relative importance to the total sales volume, demand, or any other weight that is critical to the business.
```text theme={null}
WMAPE = Σ ( w_t * |e_t| ) / Σ ( w_t * d_t )
```
### SMAPE
SMAPE is a measure of forecast accuracy that is symmetric around zero, meaning it penalizes over-forecasting and under-forecasting equally. It is the average absolute percentage error between the actual and forecasted values, divided by the average of the actual and forecasted values.
```text theme={null}
SMAPE = (1 / n) * Σ ( |f_t - d_t| / ((|d_t| + |f_t|) / 2) )
```