> ## Documentation Index
> Fetch the complete documentation index at: https://docs.simcel.io/llms.txt
> Use this file to discover all available pages before exploring further.
# Overview
> Key definitions for SIT, sales flows, and gross sales values in distributor tracking.
## Term definitions
* **SIT (Stock In Trade)** - The stock level (in days) for the specified distributor and product at the given period end.
* **Closing Stock** - The distributor's inventory records at the period's end (either in unit or value).
* **Sales-Out** - Sales from the distributors to their customers (pharmacies, hospitals, and so on). Also referred to as secondary sales (either in unit or value).
* **Sales In** - Sales to the distributors. Also referred to as primary sales (either in unit or value).
* **Distributor GSV** - The price at which the company sells the product to its distributors.
* **Customer GSV** - The price at which the distributor sells the product to its customers.
## Navigation
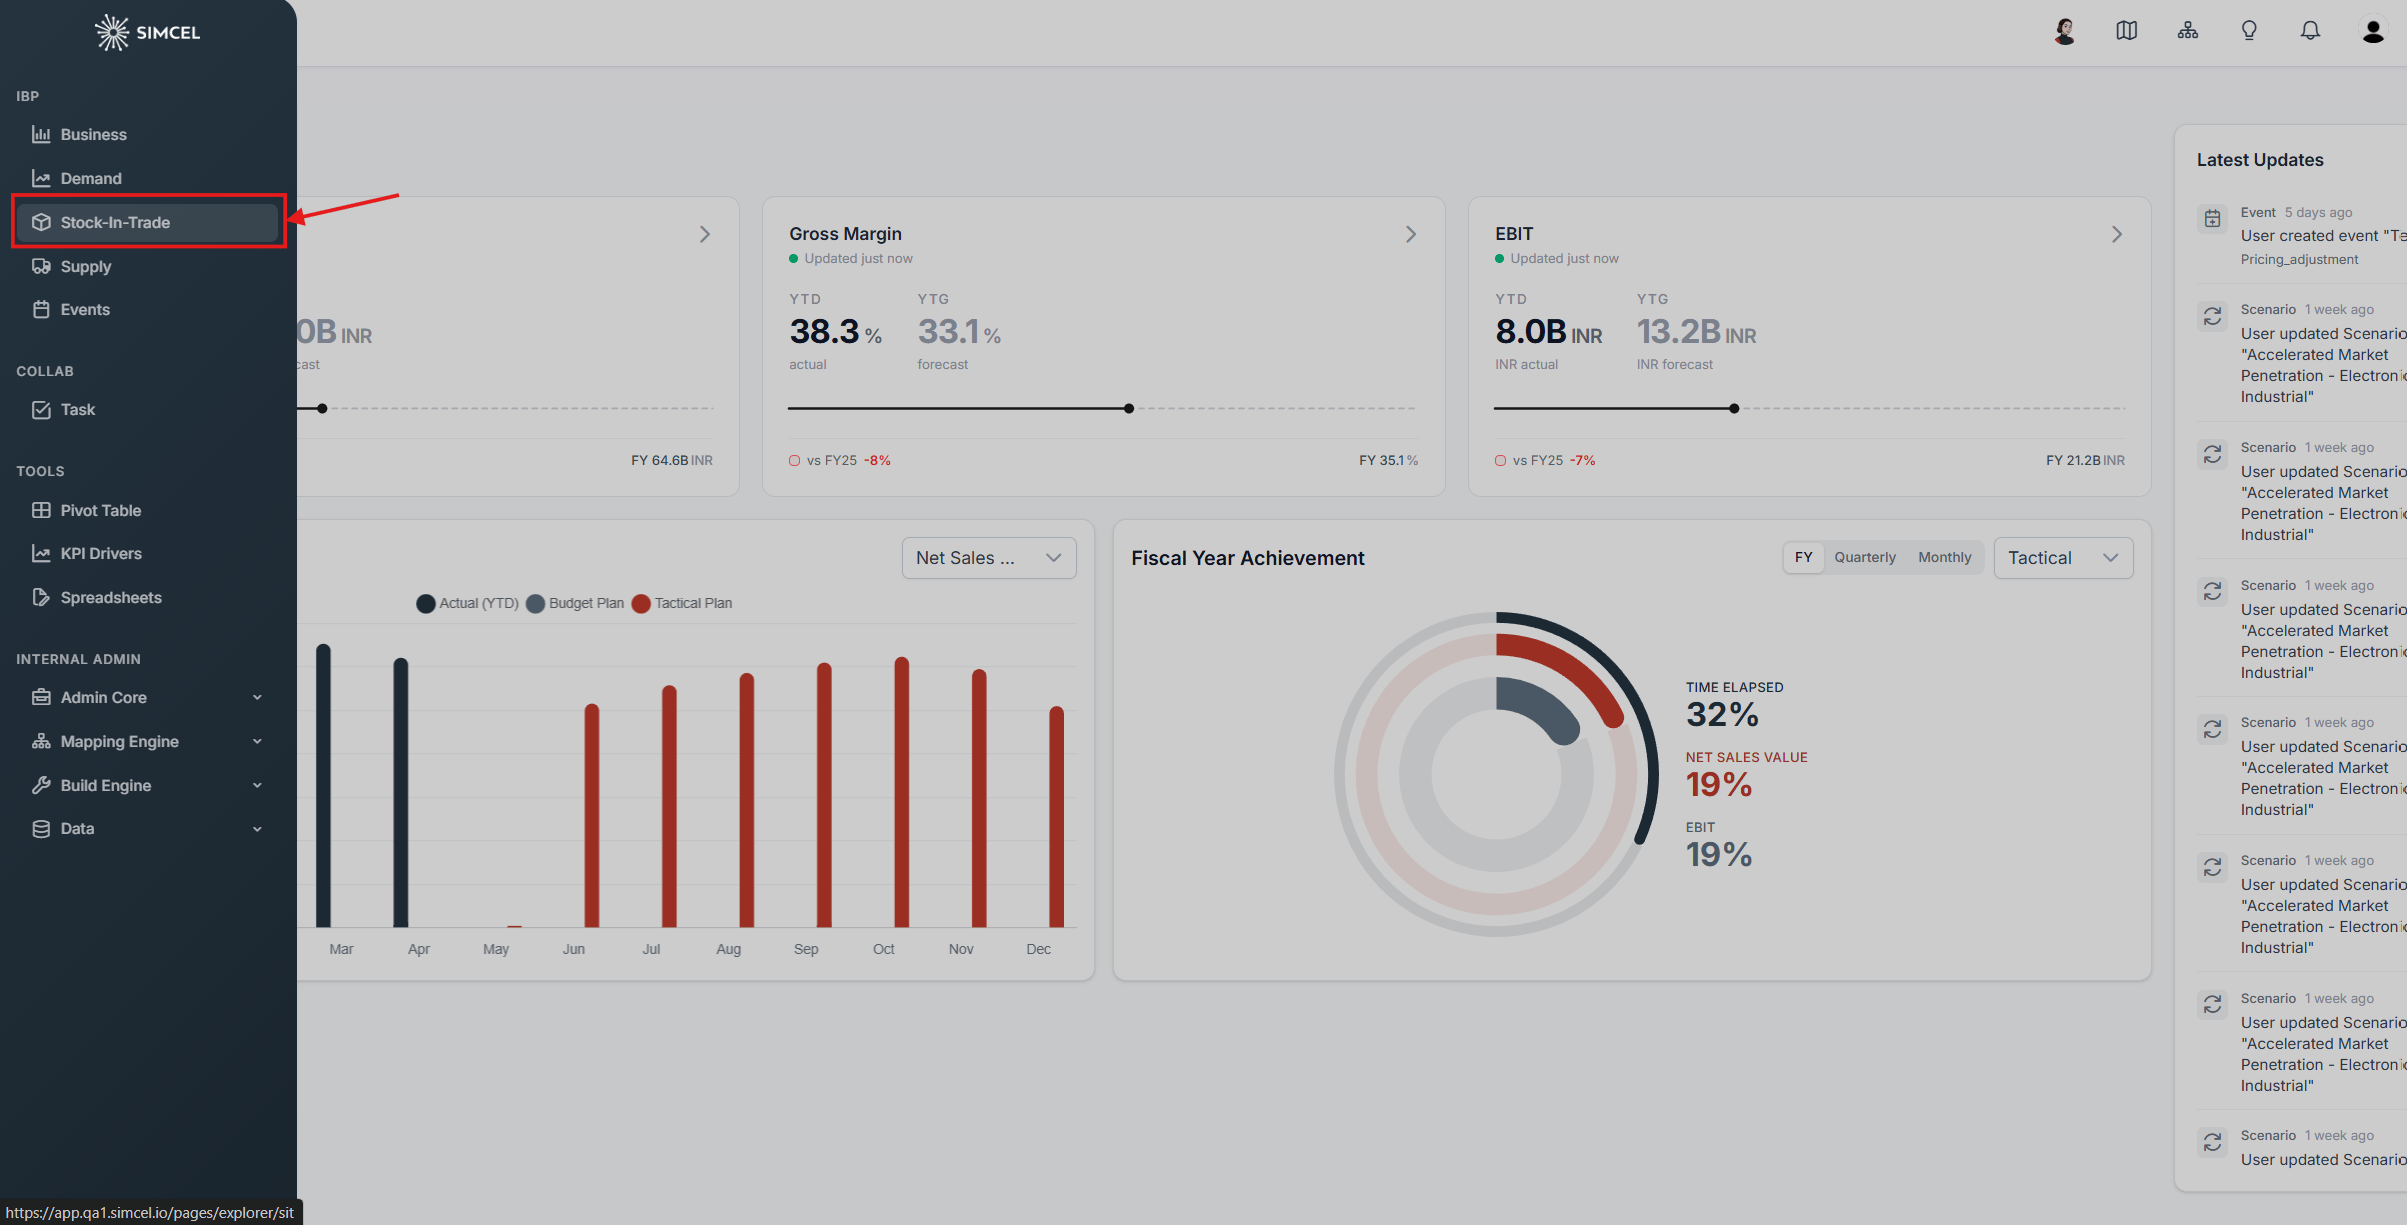
Click **Stock-In-Trade** under the IBP section on the left side panel to navigate to the SIT page.
 On this page, there are 3 main widgets:
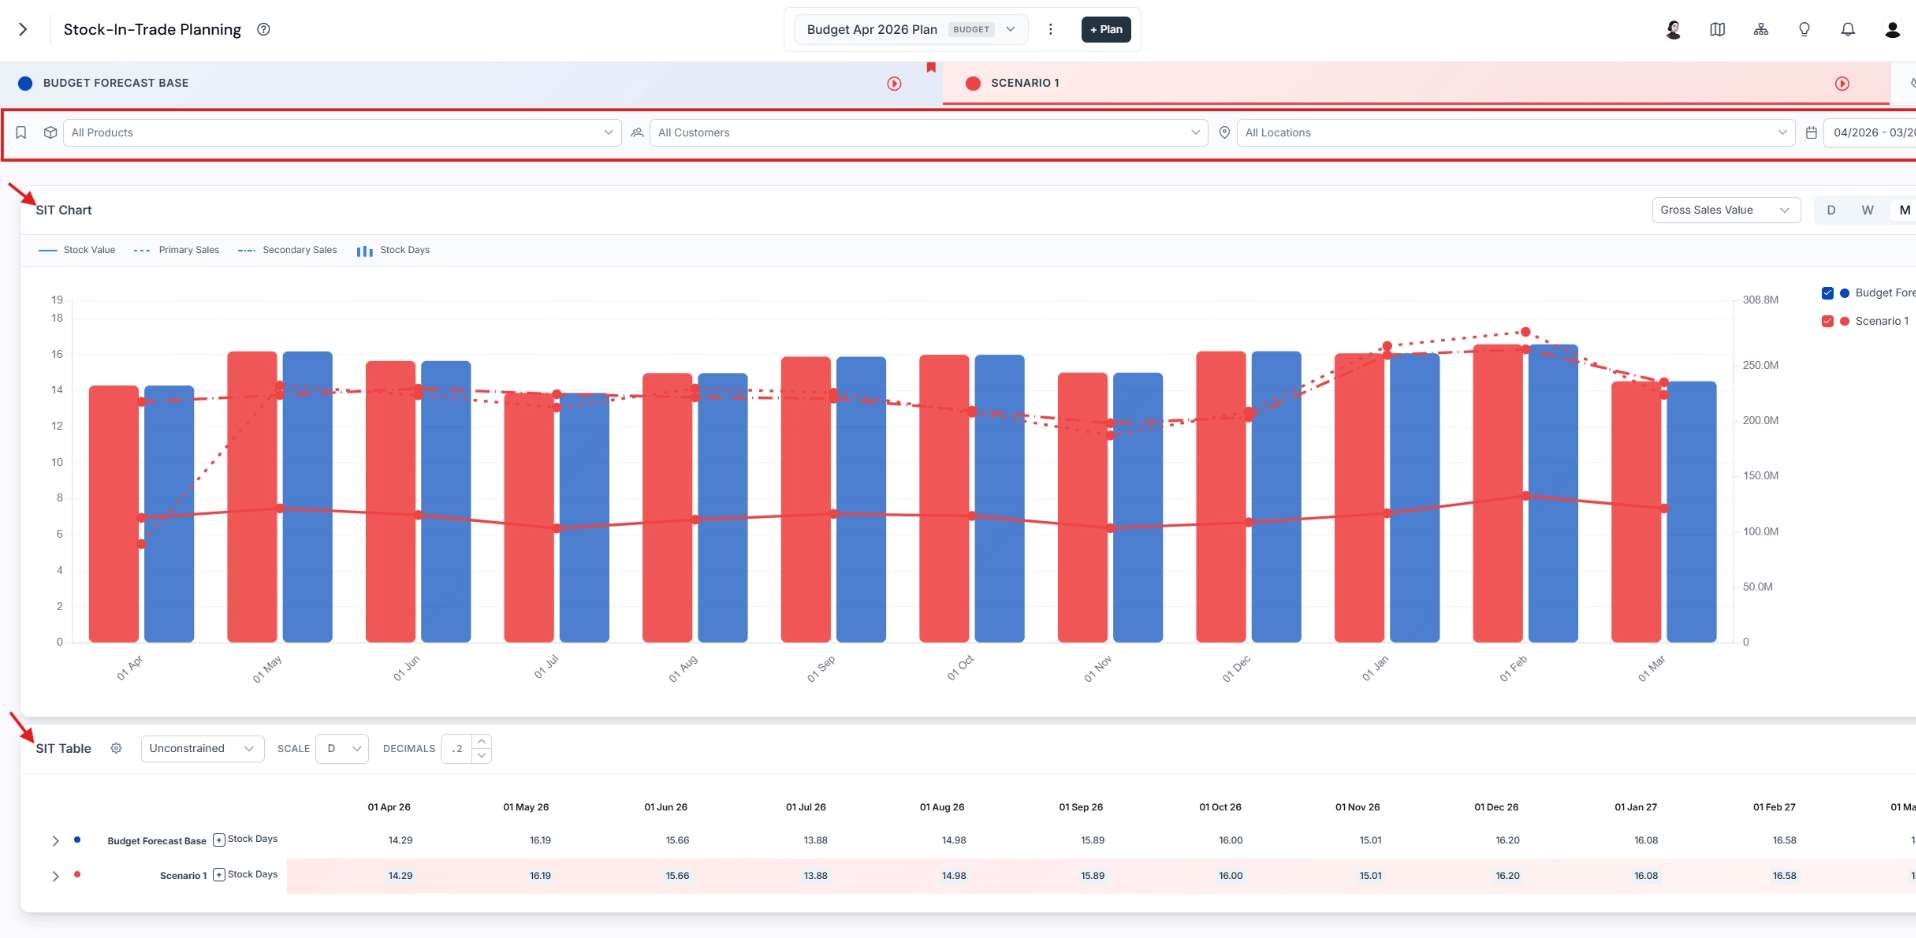 * **Page Filter** - Replicates the functionality of the Demand Planning page. However, the Customer filter is replaced by the Distributor filter.
* **SIT Chart**
* **SIT Table**
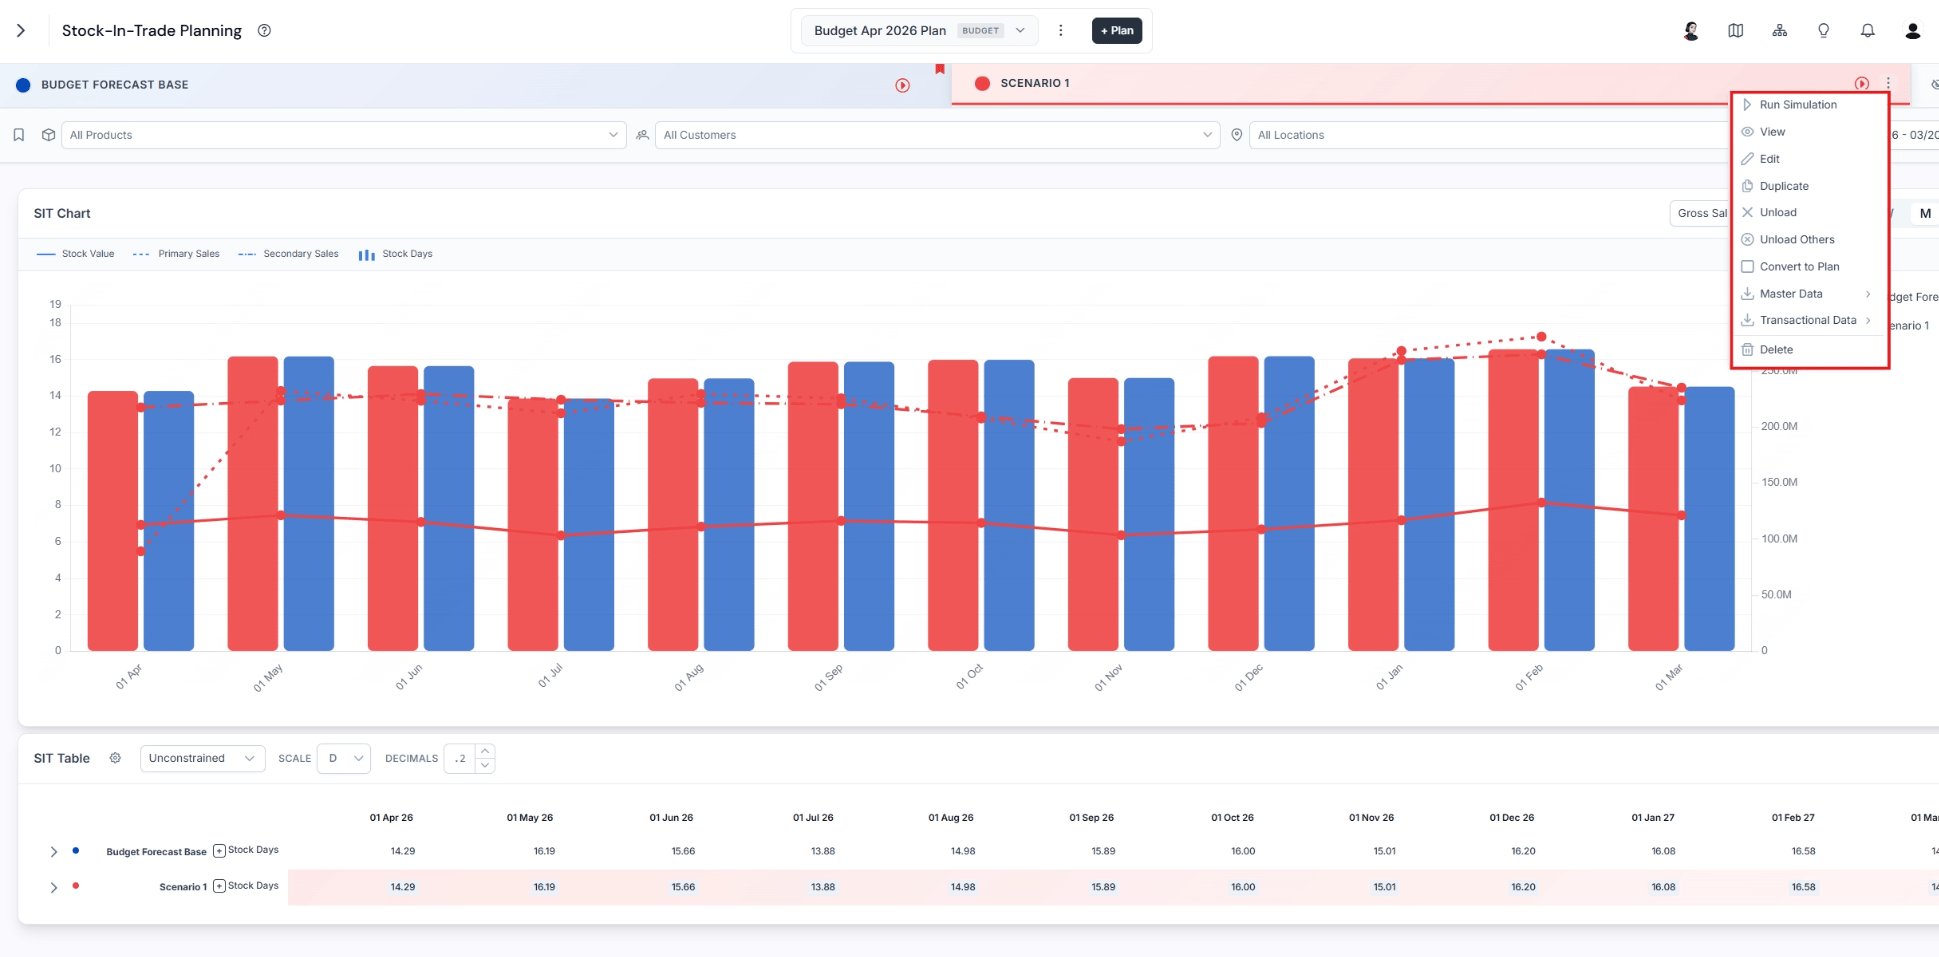
Similar to the Demand Planning page, the SIT page offers the same functionalities for interacting with scenarios.
* **Page Filter** - Replicates the functionality of the Demand Planning page. However, the Customer filter is replaced by the Distributor filter.
* **SIT Chart**
* **SIT Table**
Similar to the Demand Planning page, the SIT page offers the same functionalities for interacting with scenarios.
 ## SIT chart
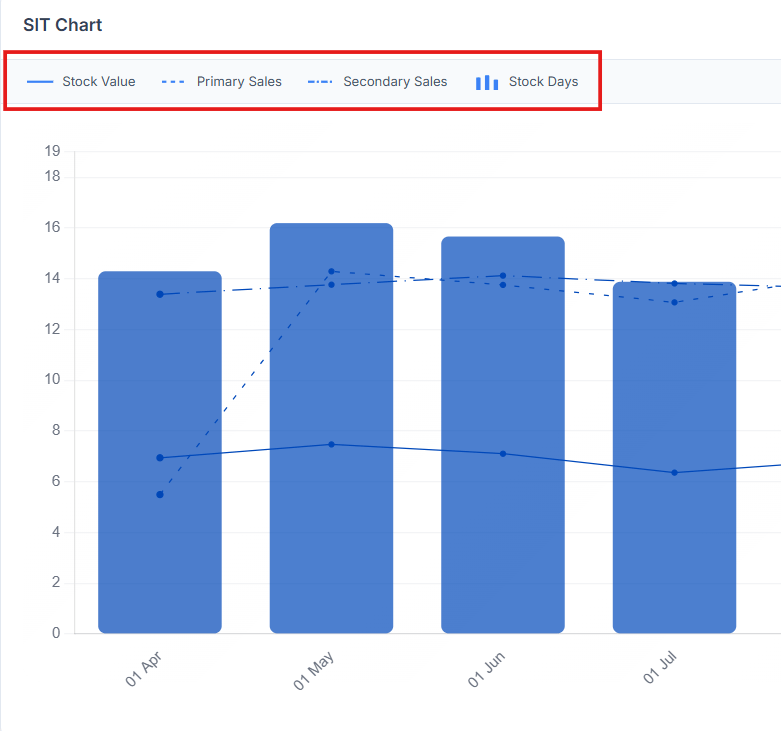
In the SIT chart, you can compare:
* **Stock Days** (bar - in days)
* **Primary Sales** (dashed line - in either value or unit)
* **Secondary Sales** (dashed and dotted line - in either value or unit)
* **Stock Value** (solid line - in either value or unit)
## SIT chart
In the SIT chart, you can compare:
* **Stock Days** (bar - in days)
* **Primary Sales** (dashed line - in either value or unit)
* **Secondary Sales** (dashed and dotted line - in either value or unit)
* **Stock Value** (solid line - in either value or unit)
 ## SIT table
The **SIT Table** allows you to edit the scenario's **Stock Days**, **Stock Value**, and **Primary Sales** by segment.
Like the **Demand Table**, the **SIT Table** can also drill down for detailed data on finer segments.
## SIT table
The **SIT Table** allows you to edit the scenario's **Stock Days**, **Stock Value**, and **Primary Sales** by segment.
Like the **Demand Table**, the **SIT Table** can also drill down for detailed data on finer segments.
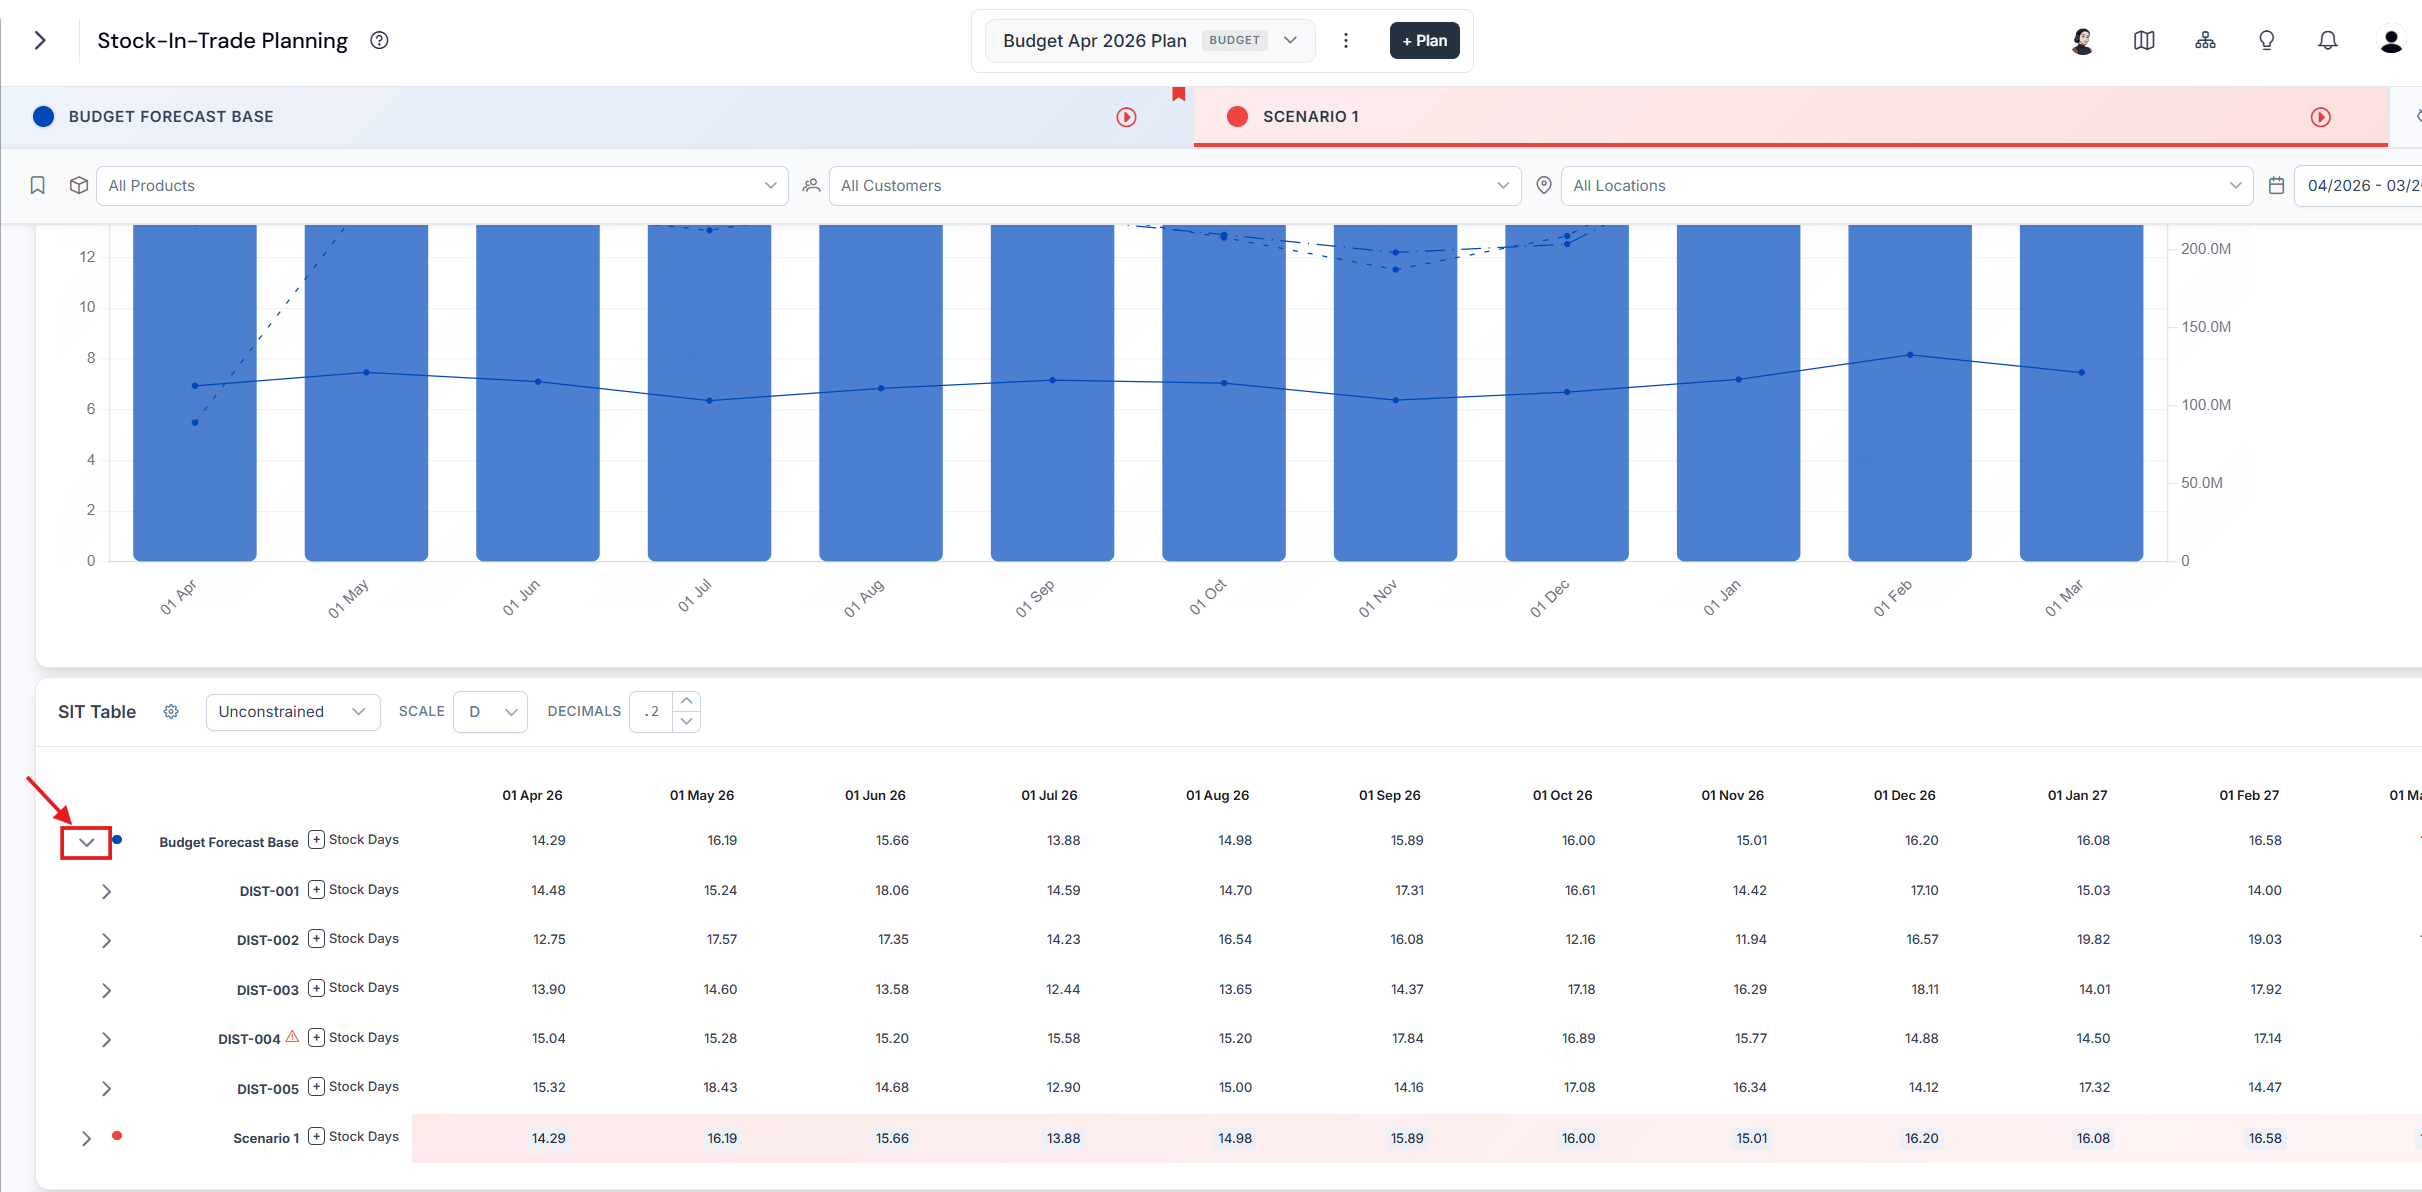 By default, you can only see and edit the SIT target.
 When you click the drop-down button, you can also see the value of the **Stock Value**, **Secondary Sales**, and **Primary Sales**. However, Secondary Sales is not an editable value on this screen because it comes from the Demand Planning page.
 ## SIT modes: unconstrained vs constrained
SIMCEL operates in two distinct SIT planning modes, each reflecting a different stage of the scenario lifecycle and the nature of data used in the calculations.
## SIT modes: unconstrained vs constrained
SIMCEL operates in two distinct SIT planning modes, each reflecting a different stage of the scenario lifecycle and the nature of data used in the calculations.
 ### 1. Unconstrained mode
This is the default mode when a scenario is created but **before simulation is triggered**. All KPIs on the SIT page are calculated based on:
* **Unconstrained Secondary Sales** - Planned downstream sales from distributor to market, prior to any restriction from stock availability.
* **Unconstrained Primary Sales** - Planned inbound supply from upstream (for example, corporate to distributor), without taking supply constraints into account.
* **Gross Value** basis for financials - discounts, rebates, and other trade terms are not applied yet.
In **Unconstrained Mode**, all metrics are editable except Secondary Sales, which is populated from the demand plan.
### 2. Constrained mode
This mode becomes available **after a simulation is run**. The simulation aligns product availability (based on inventory and supply plan) with demand, resulting in constrained flows. KPIs are recalculated based on:
* **Constrained Primary Sales** - Actual feasible supply to distributor based on inventory and replenishment limits.
* **Constrained Secondary Sales** - Expected downstream sales based on Sales In and available inventory at the distributor.
* Still computed on a **Gross Value** basis in the SIT module (even if trade terms are simulated elsewhere).
In **Constrained Mode**, none of the metrics are editable.
## Unconstrained mode - adjusting metrics for a specific scenario (SIT table)
In the SIT table, numbers highlighted with a subtle grey background can be edited. You can adjust the following:
* Stock Days (days)
* Stock Value (unit or value)
* Primary Sales (unit or value)
To edit a number, click it. An edit box appears for you to make changes.
### 1. Unconstrained mode
This is the default mode when a scenario is created but **before simulation is triggered**. All KPIs on the SIT page are calculated based on:
* **Unconstrained Secondary Sales** - Planned downstream sales from distributor to market, prior to any restriction from stock availability.
* **Unconstrained Primary Sales** - Planned inbound supply from upstream (for example, corporate to distributor), without taking supply constraints into account.
* **Gross Value** basis for financials - discounts, rebates, and other trade terms are not applied yet.
In **Unconstrained Mode**, all metrics are editable except Secondary Sales, which is populated from the demand plan.
### 2. Constrained mode
This mode becomes available **after a simulation is run**. The simulation aligns product availability (based on inventory and supply plan) with demand, resulting in constrained flows. KPIs are recalculated based on:
* **Constrained Primary Sales** - Actual feasible supply to distributor based on inventory and replenishment limits.
* **Constrained Secondary Sales** - Expected downstream sales based on Sales In and available inventory at the distributor.
* Still computed on a **Gross Value** basis in the SIT module (even if trade terms are simulated elsewhere).
In **Constrained Mode**, none of the metrics are editable.
## Unconstrained mode - adjusting metrics for a specific scenario (SIT table)
In the SIT table, numbers highlighted with a subtle grey background can be edited. You can adjust the following:
* Stock Days (days)
* Stock Value (unit or value)
* Primary Sales (unit or value)
To edit a number, click it. An edit box appears for you to make changes.
 * Secondary Sales is configured on the Demand Planning page using events. Editing these figures directly on this page is not permitted.
* Adjustments you make cannot be undone.
### Editing SIT target / closing stock
When you create a scenario, SIMCEL uses the standard SIT targets (defined per product-distributor) and computes the other metrics accordingly.
When you edit the SIT target or Closing Stock for a specific segment, the system carries out these steps:
1. Calculate the related Closing Stock / SIT target, and Sales In at that level using the new SIT value.
2. Update the Closing Stock, Sales In, and SIT at that level for the following months.
3. Re-calculate the Closing Stock values for the child levels based on the percentage increase or decrease of the direct parent.
4. Re-calculate the impact on Sales In and SIT for the child level, including the following months.
5. Adjust the Closing Stock and Sales In values for the parent levels to ensure they equal the total of their direct children.
6. Re-calculate the SIT for the parent level.
Refer to the **Calculation Logic** section for the specific formulas.
### Editing Sales In
When you edit the Sales In for a specific segment, the system carries out these steps:
1. Calculate the related Closing Stock and SIT at that level using the new Sales In value.
2. Update the Closing Stock, Sales In, and SIT at that level for the following months.
3. Re-allocate the Sales In values for the child levels based on the percentage increase or decrease of the direct parent.
4. Re-calculate the impact on Closing Stock and SIT for the child level.
5. Adjust the Sales In and Closing Stock values for the parent levels to ensure they equal the total of the child levels.
6. Re-calculate the SIT for the parent level.
Refer to the **Calculation Logic** section for the specific formulas.
### Quick SIT metrics setting
In the SIT table, you can configure SIT metrics (Stock Days, Stock Value, Primary Sales) across a continuous range of months by entering a single value in a selected month and applying it forward through the remaining plan timeline.
To do a quick SIT metrics setting for a scenario:
Select the starting month and the metric you want to edit quickly.
* Secondary Sales is configured on the Demand Planning page using events. Editing these figures directly on this page is not permitted.
* Adjustments you make cannot be undone.
### Editing SIT target / closing stock
When you create a scenario, SIMCEL uses the standard SIT targets (defined per product-distributor) and computes the other metrics accordingly.
When you edit the SIT target or Closing Stock for a specific segment, the system carries out these steps:
1. Calculate the related Closing Stock / SIT target, and Sales In at that level using the new SIT value.
2. Update the Closing Stock, Sales In, and SIT at that level for the following months.
3. Re-calculate the Closing Stock values for the child levels based on the percentage increase or decrease of the direct parent.
4. Re-calculate the impact on Sales In and SIT for the child level, including the following months.
5. Adjust the Closing Stock and Sales In values for the parent levels to ensure they equal the total of their direct children.
6. Re-calculate the SIT for the parent level.
Refer to the **Calculation Logic** section for the specific formulas.
### Editing Sales In
When you edit the Sales In for a specific segment, the system carries out these steps:
1. Calculate the related Closing Stock and SIT at that level using the new Sales In value.
2. Update the Closing Stock, Sales In, and SIT at that level for the following months.
3. Re-allocate the Sales In values for the child levels based on the percentage increase or decrease of the direct parent.
4. Re-calculate the impact on Closing Stock and SIT for the child level.
5. Adjust the Sales In and Closing Stock values for the parent levels to ensure they equal the total of the child levels.
6. Re-calculate the SIT for the parent level.
Refer to the **Calculation Logic** section for the specific formulas.
### Quick SIT metrics setting
In the SIT table, you can configure SIT metrics (Stock Days, Stock Value, Primary Sales) across a continuous range of months by entering a single value in a selected month and applying it forward through the remaining plan timeline.
To do a quick SIT metrics setting for a scenario:
Select the starting month and the metric you want to edit quickly.
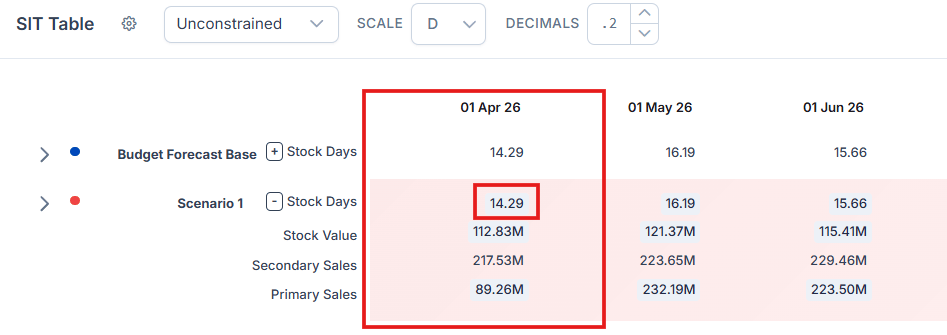 Click the number within that month and metric. An edit box appears for you to make changes.
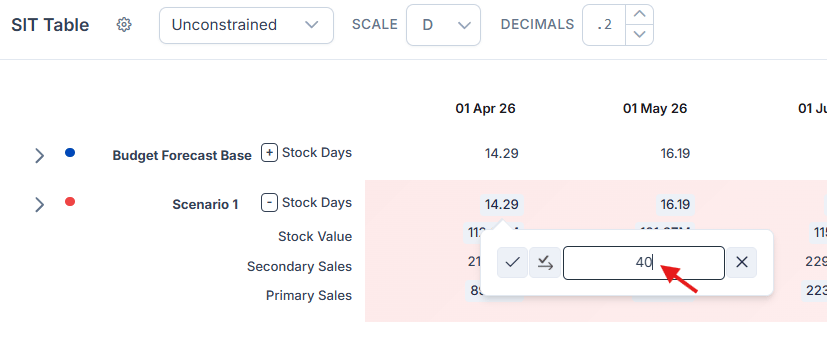 After you enter the new number, look to the left of the edit box to find a checkmark with a right arrow. Click it.
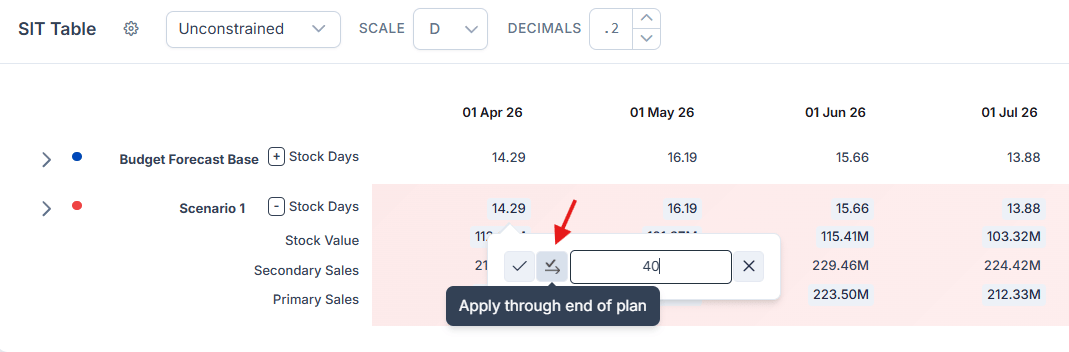 A dialogue appears, showing:
1. The SIT metric being quickly set (Stock Days, Stock Value, or Primary Sales). For example, **Stock Days**.
2. The edited month. For example, **2026-04-01**.
3. The ending month of the plan. For example, **2027-03-31**.
A dialogue appears, showing:
1. The SIT metric being quickly set (Stock Days, Stock Value, or Primary Sales). For example, **Stock Days**.
2. The edited month. For example, **2026-04-01**.
3. The ending month of the plan. For example, **2027-03-31**.
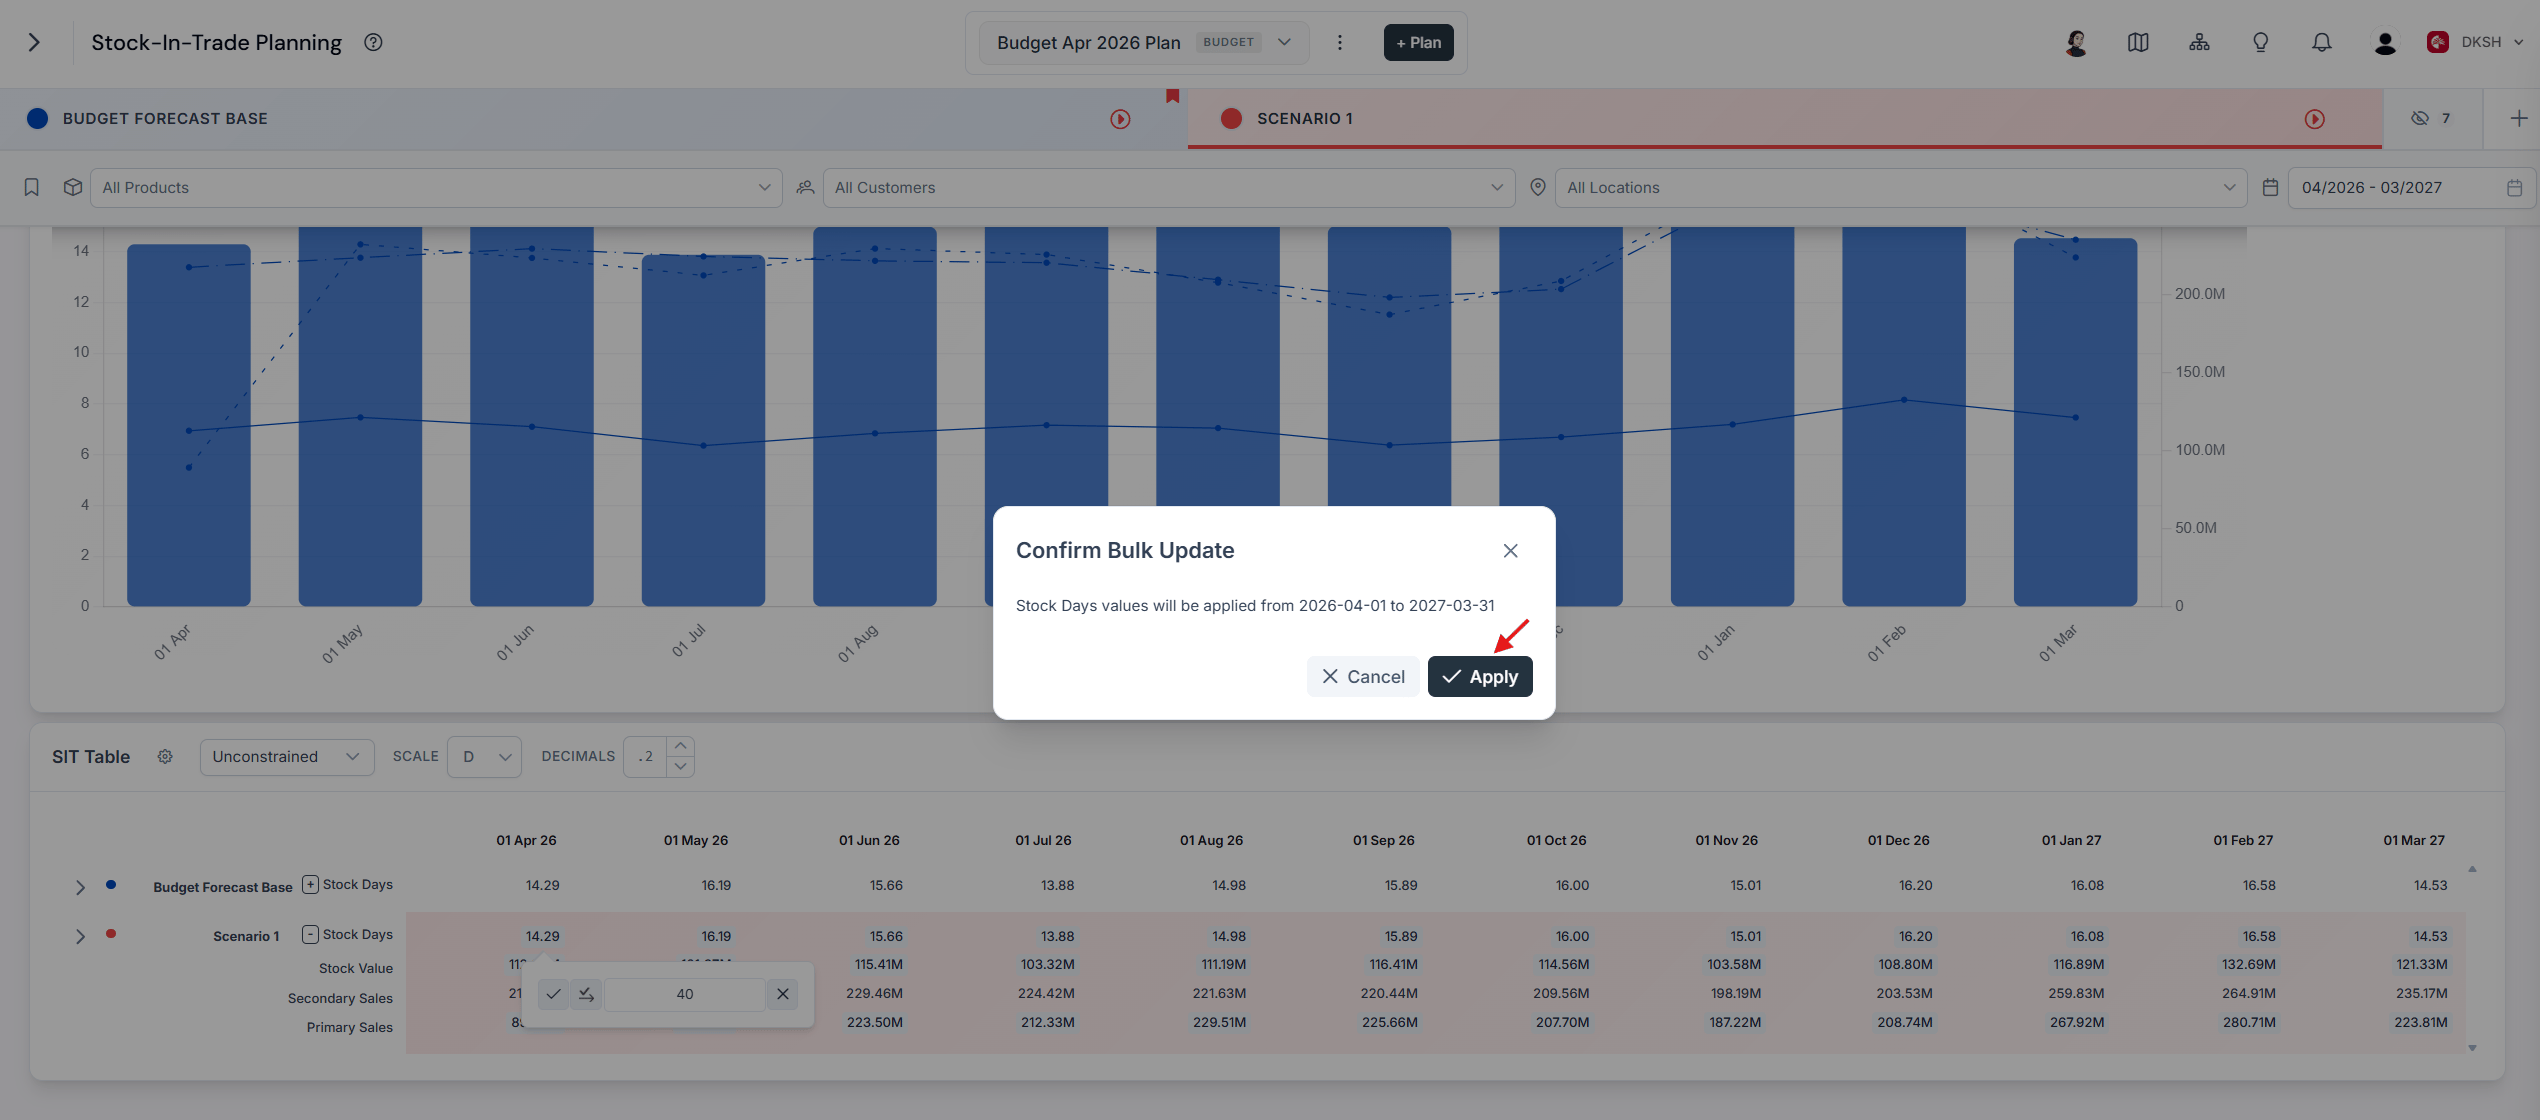 Click **Apply** to confirm your choice and let the system recalculate everything to align with your new settings.