> ## Documentation Index
> Fetch the complete documentation index at: https://docs.simcel.io/llms.txt
> Use this file to discover all available pages before exploring further.
# KPI drivers
> Explore the best and worst-performing segments by comparing two KPIs across two dimensions.
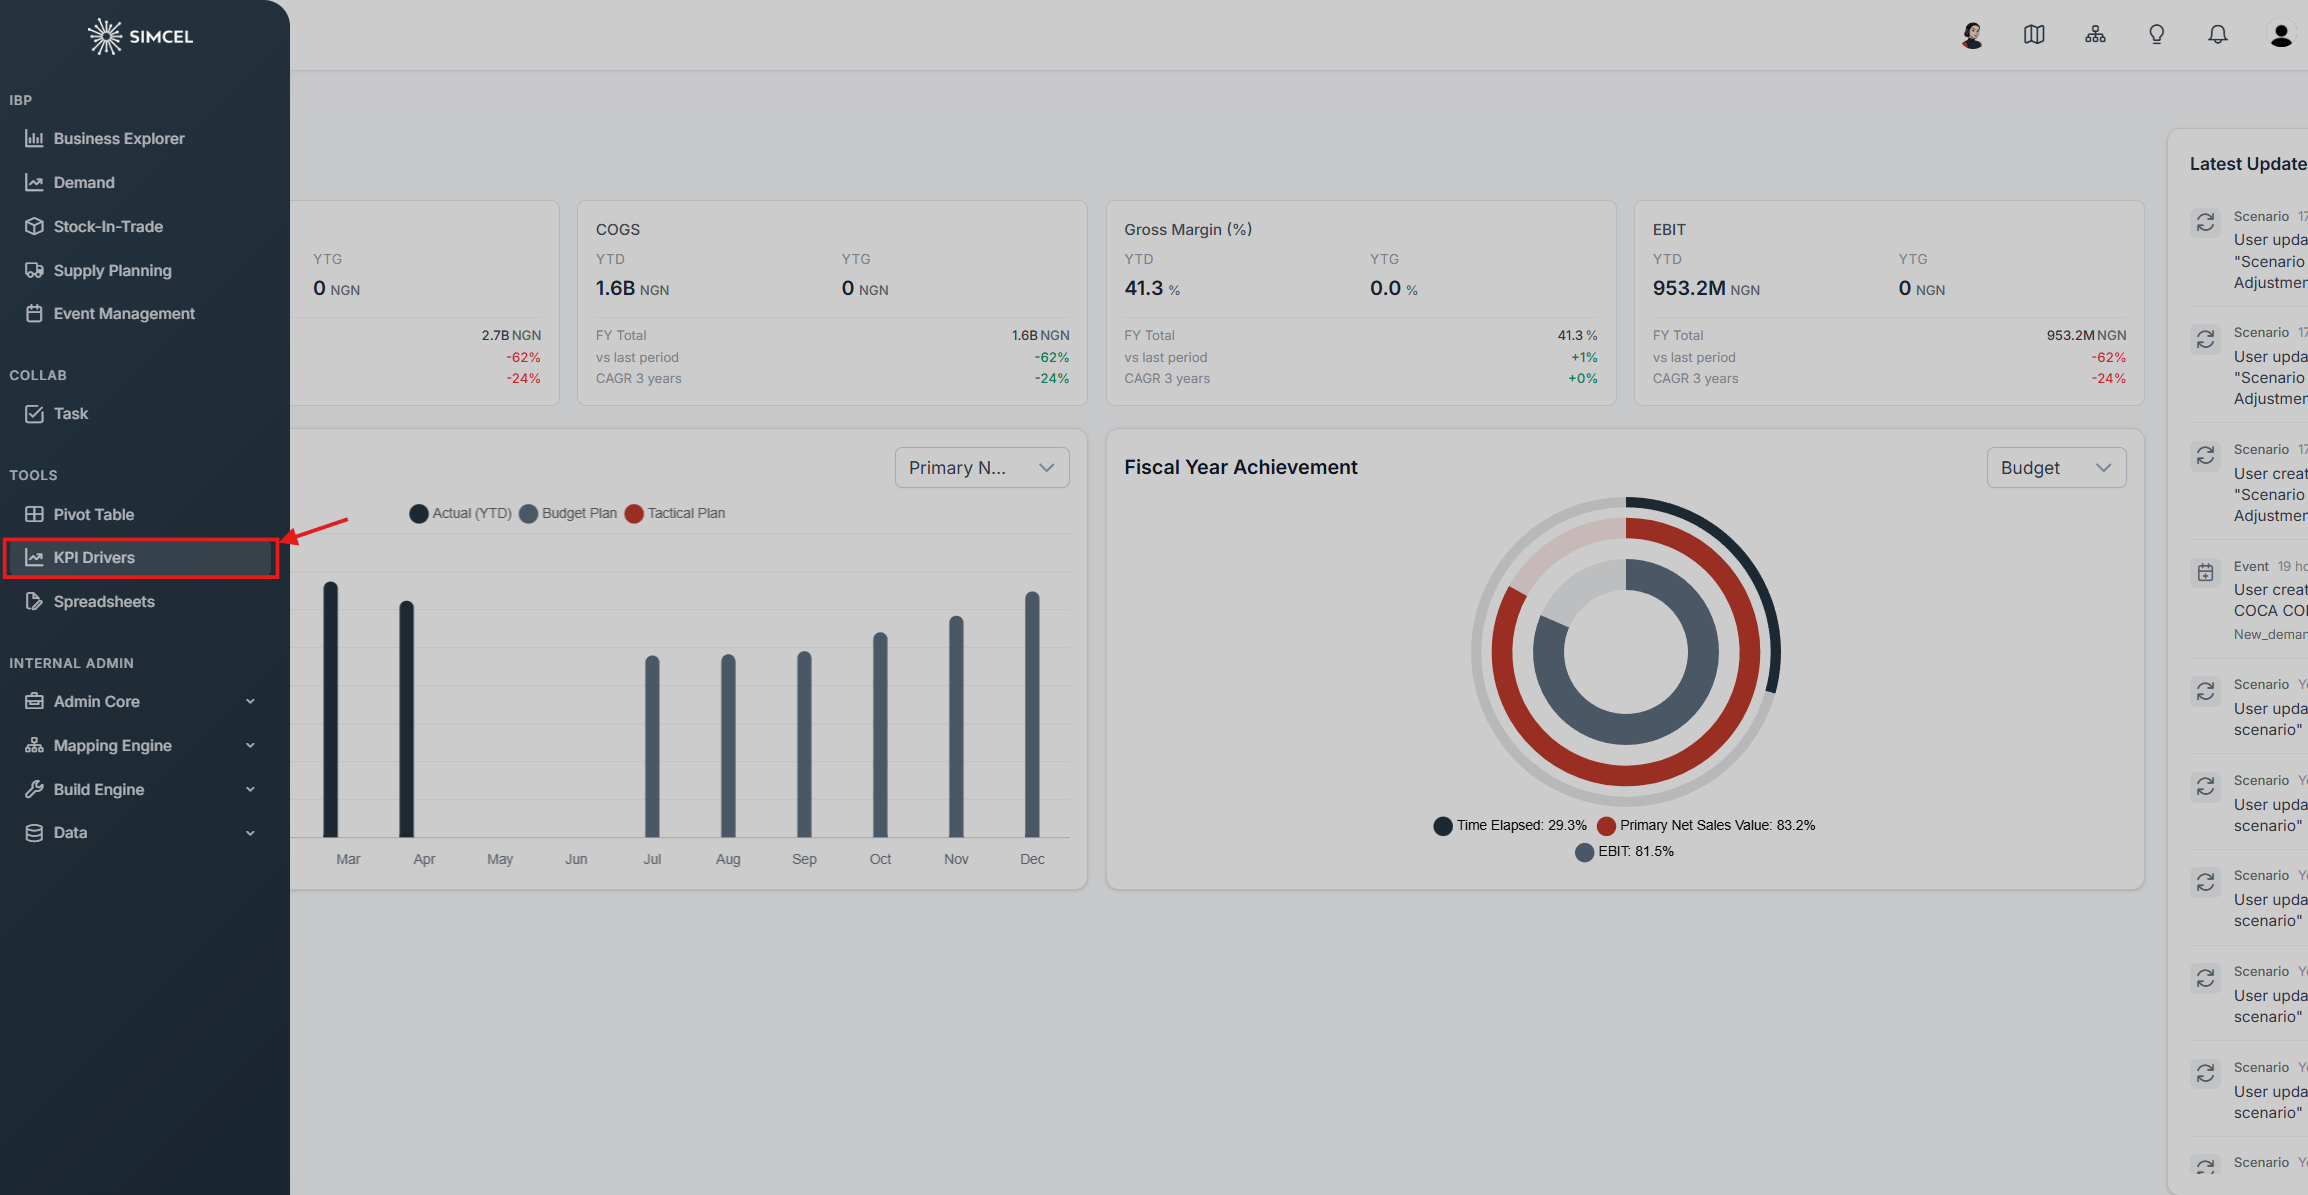
To access the Business Drivers widget, click **KPI Drivers** under the Tools section on the left-side panel.
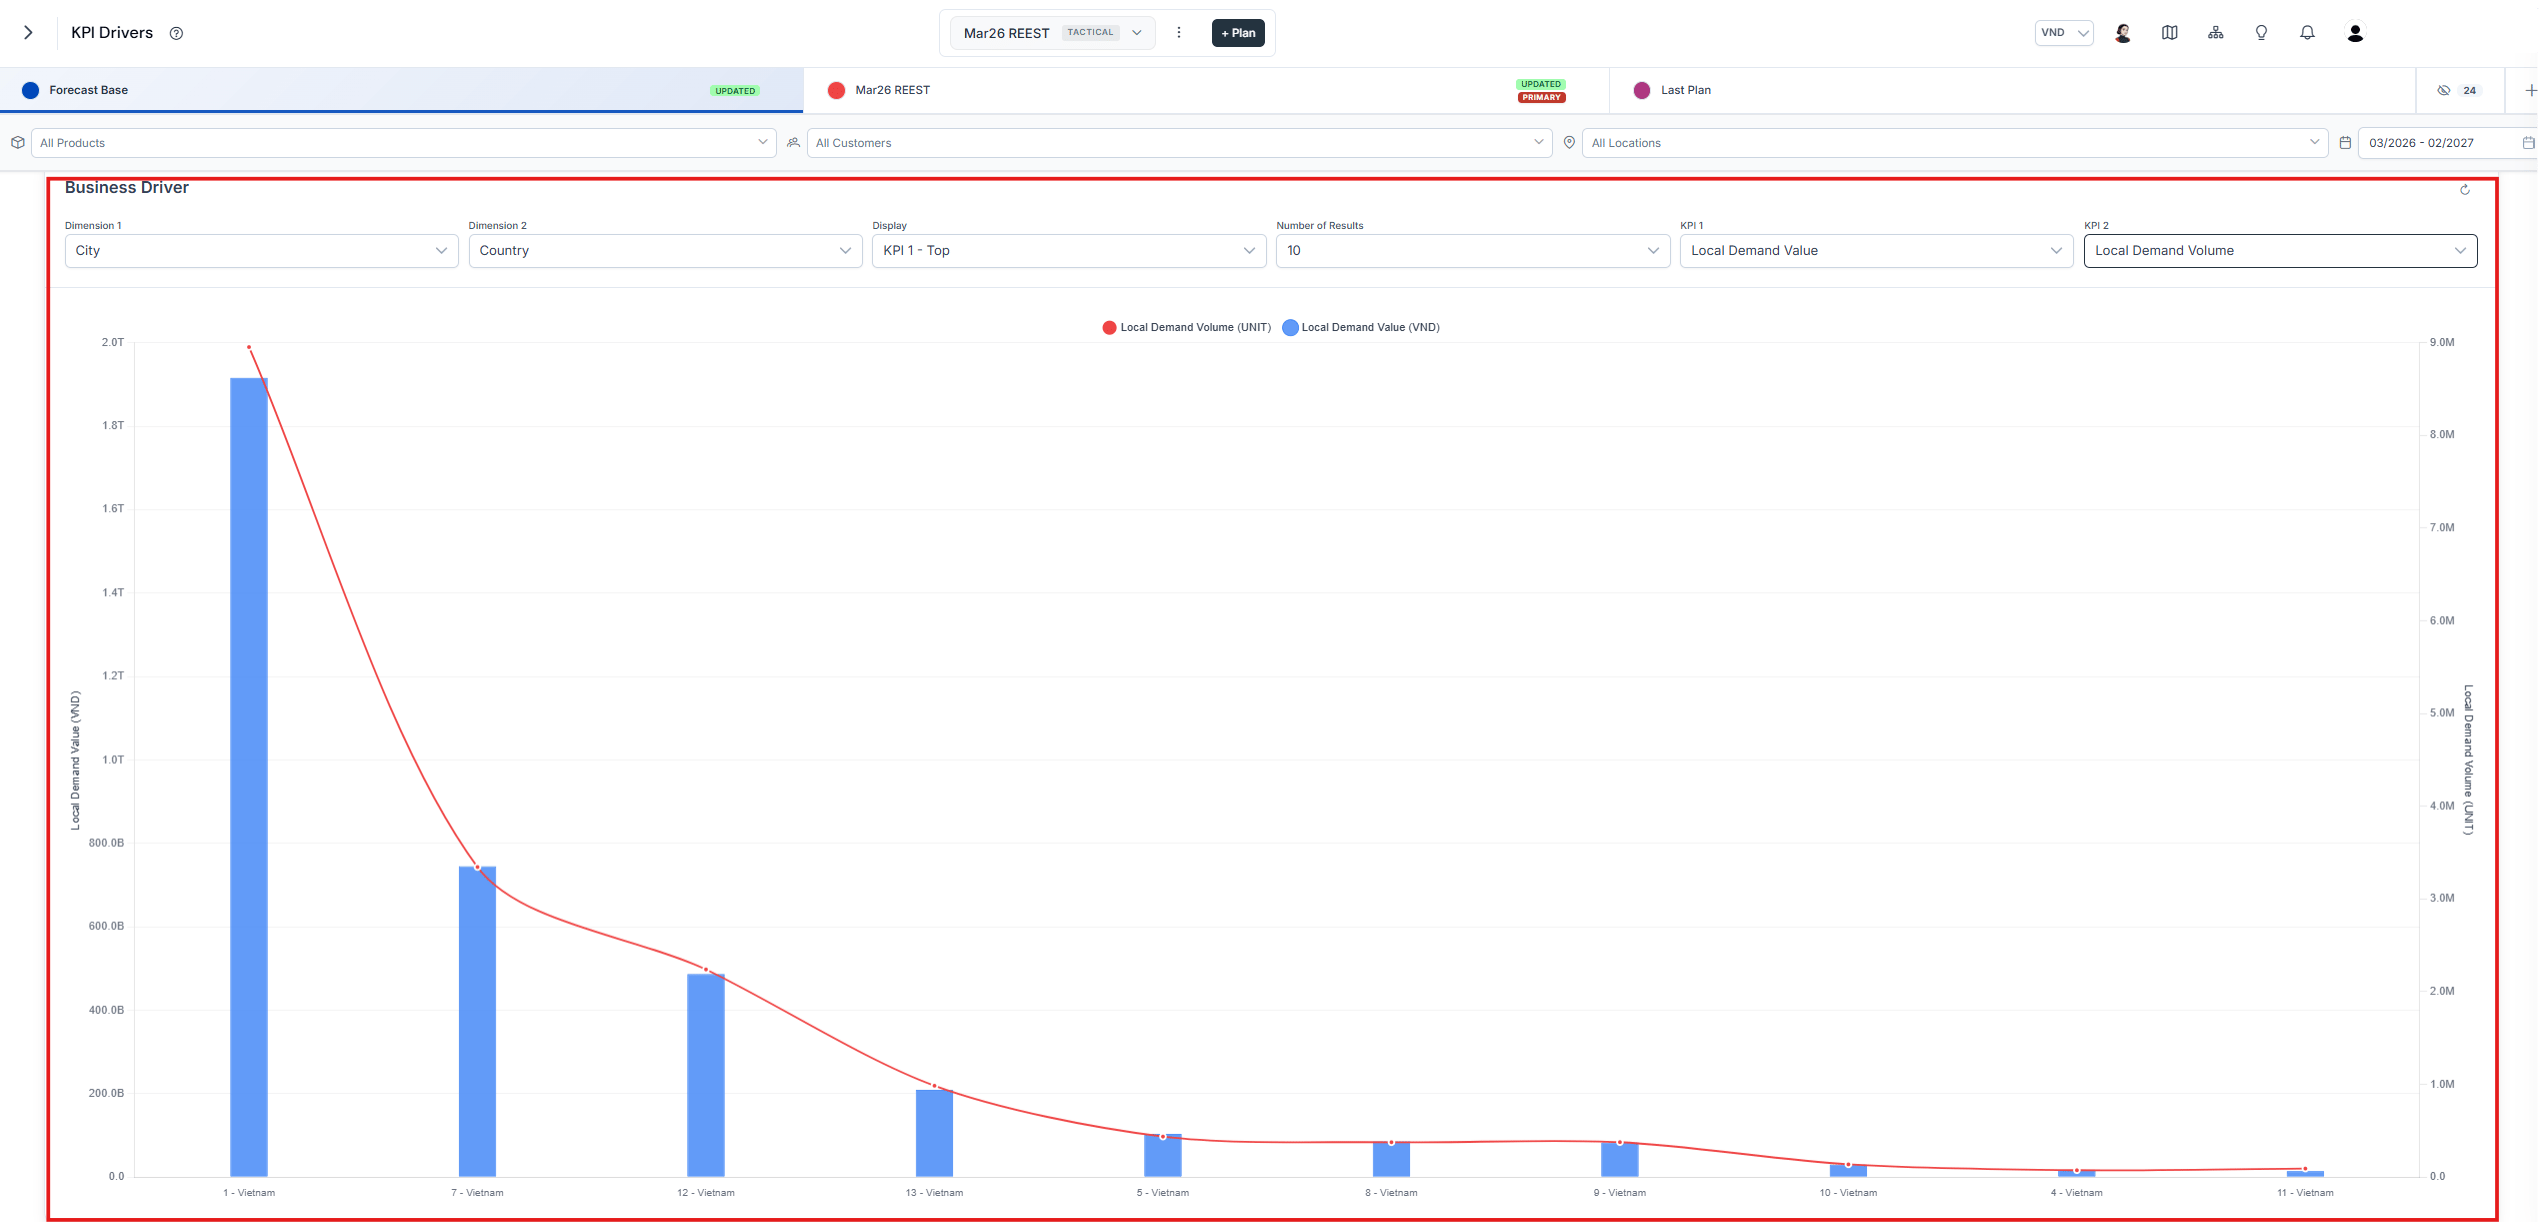
 This widget lets you explore the best and worst-performing segments according to the KPIs you select.
## How to use it
* **Dimension 1 (x-axis)**: Select the first category to segment data (for example, product ID or category).
* **Dimension 2 (x-axis)**: Select the second category for further segmentation.
* **Display**: Choose the top 10 or bottom 10 values for KPI 1 or KPI 2.
* **KPI 1 (bar, left y-axis)**: Choose the first key performance indicator.
* **KPI 2 (line, right y-axis)**: Choose the second key performance indicator.
The chart updates automatically to display the relevant data.
This widget lets you explore the best and worst-performing segments according to the KPIs you select.
## How to use it
* **Dimension 1 (x-axis)**: Select the first category to segment data (for example, product ID or category).
* **Dimension 2 (x-axis)**: Select the second category for further segmentation.
* **Display**: Choose the top 10 or bottom 10 values for KPI 1 or KPI 2.
* **KPI 1 (bar, left y-axis)**: Choose the first key performance indicator.
* **KPI 2 (line, right y-axis)**: Choose the second key performance indicator.
The chart updates automatically to display the relevant data.
 ## Example
**Scenario**: Identify the products with the highest demand and evaluate their service levels country wide.
* **Dimension 1**: Product ID
* **Dimension 2**: Country
* **Display**: KPI 1 - Top 10
* **KPI 1**: Unconstrained Gross Sales In Value
* **KPI 2**: Service Level
* **Action**: Investigate low service levels, alert headquarters to increase supply, and develop a plan to improve service levels.
## KPI driver chain
The P\&L waterfall shows how KPIs cascade from revenue to profit:
```text theme={null}
Gross FIE Sales
- FIE Trade Expenses
= Net FIE Sales
- Distributor COGS
= Gross Profit
- Transport
- Storage & Handling
= Supply Chain Cost
- Promotion
- Medical Affairs
= DPM
- Administration
= EBIT
```
Use the chain to trace a change in an outcome KPI such as EBIT back to the input KPI driving it, to see which downstream KPIs a driver affects, and to decide which KPIs to prioritize in planning.
## Example
**Scenario**: Identify the products with the highest demand and evaluate their service levels country wide.
* **Dimension 1**: Product ID
* **Dimension 2**: Country
* **Display**: KPI 1 - Top 10
* **KPI 1**: Unconstrained Gross Sales In Value
* **KPI 2**: Service Level
* **Action**: Investigate low service levels, alert headquarters to increase supply, and develop a plan to improve service levels.
## KPI driver chain
The P\&L waterfall shows how KPIs cascade from revenue to profit:
```text theme={null}
Gross FIE Sales
- FIE Trade Expenses
= Net FIE Sales
- Distributor COGS
= Gross Profit
- Transport
- Storage & Handling
= Supply Chain Cost
- Promotion
- Medical Affairs
= DPM
- Administration
= EBIT
```
Use the chain to trace a change in an outcome KPI such as EBIT back to the input KPI driving it, to see which downstream KPIs a driver affects, and to decide which KPIs to prioritize in planning.