> ## Documentation Index
> Fetch the complete documentation index at: https://docs.simcel.io/llms.txt
> Use this file to discover all available pages before exploring further.
# Pivot table
> Interactively explore, organize, filter, and summarize KPIs across datasets.
This widget is a dynamic tool for interactively exploring, organizing, filtering, and summarizing KPIs across datasets.
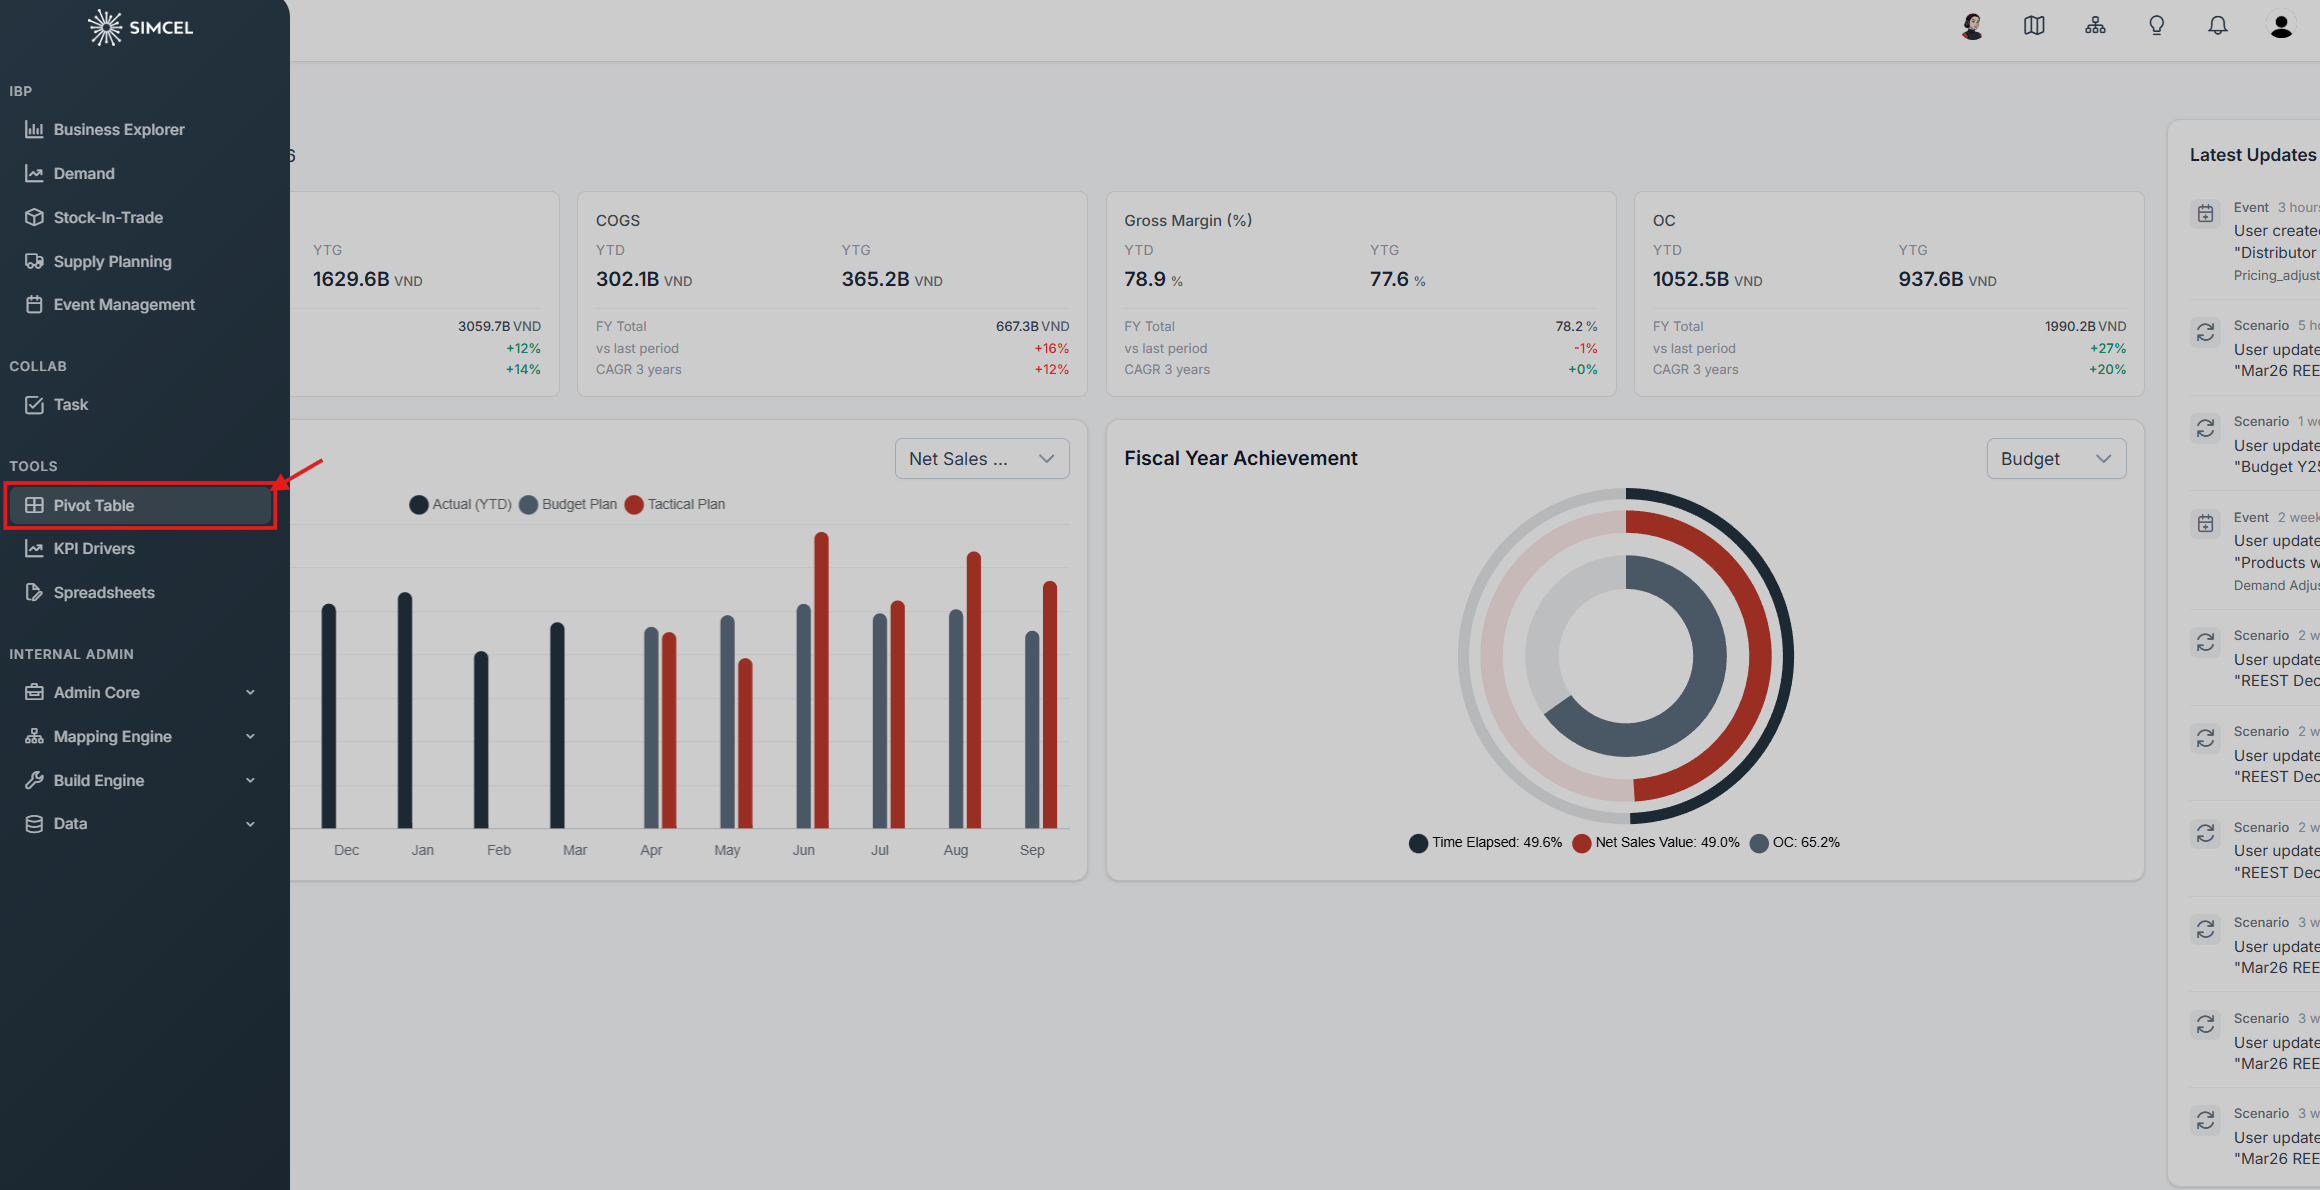
To access this tool, click **Pivot Table** under the Tools section on the left-side panel.
 ## Key features
### Dynamic data selection
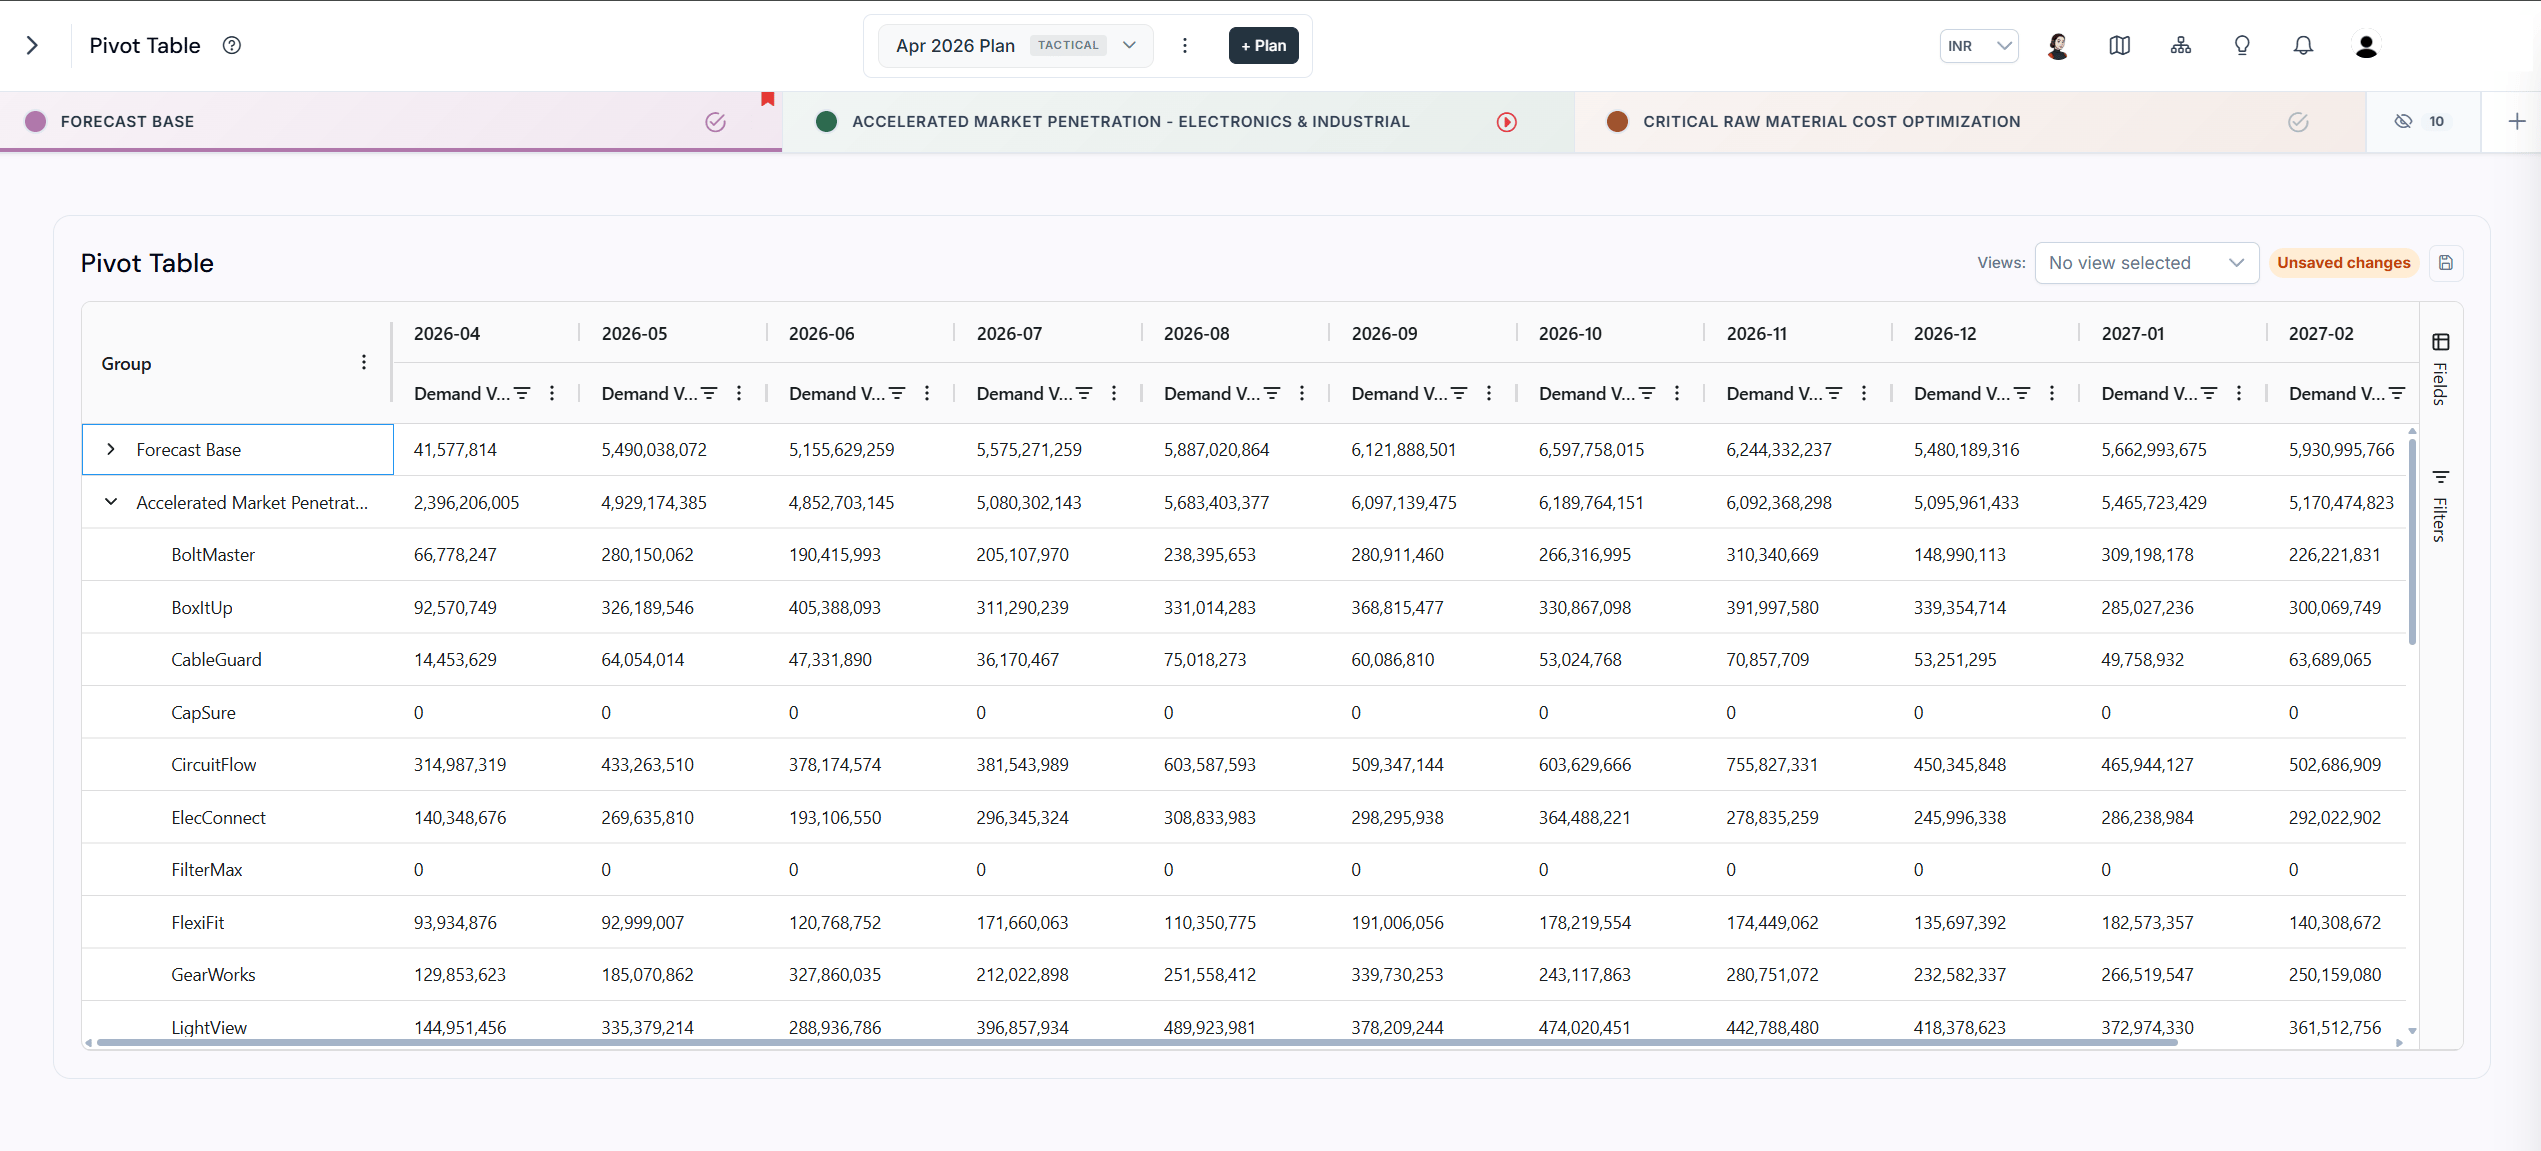
You can choose datasets and time periods (for example Actuals, Budgets, Plans) to populate the pivot table.
## Key features
### Dynamic data selection
You can choose datasets and time periods (for example Actuals, Budgets, Plans) to populate the pivot table.
 ### Customizable rows and columns
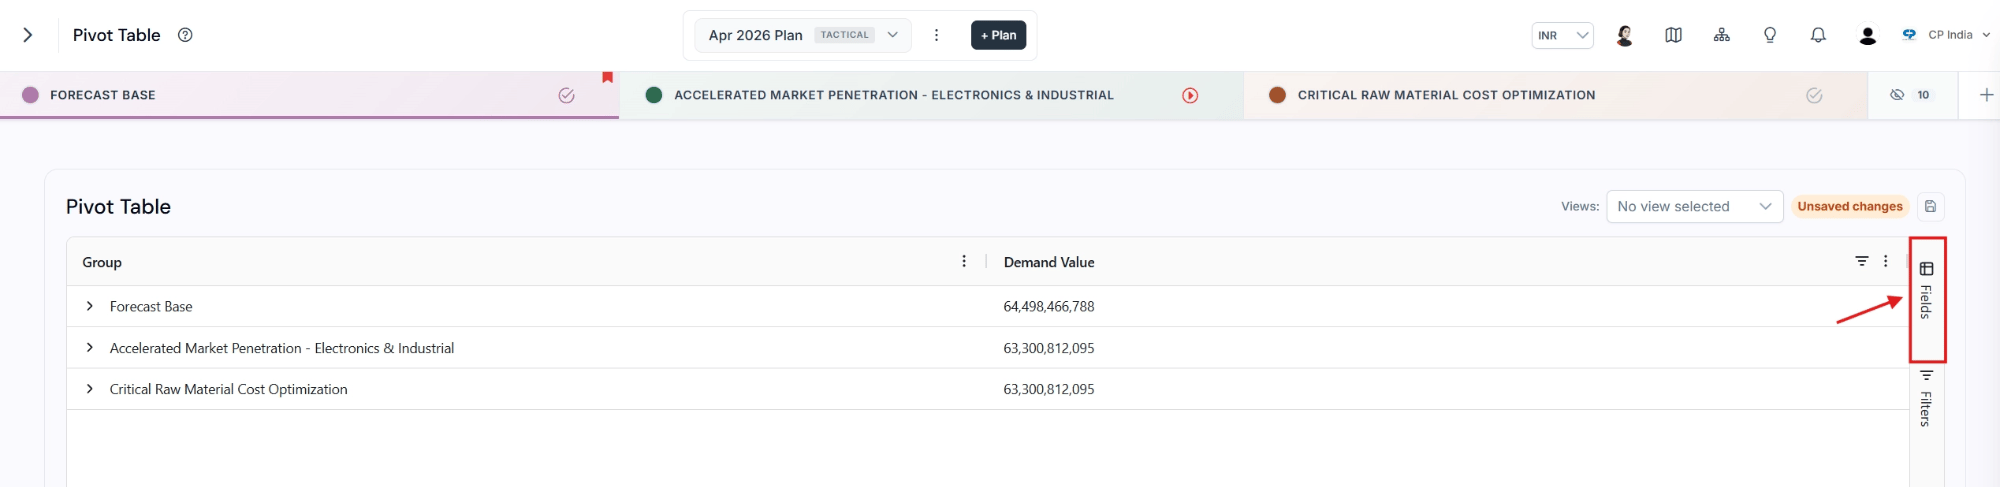
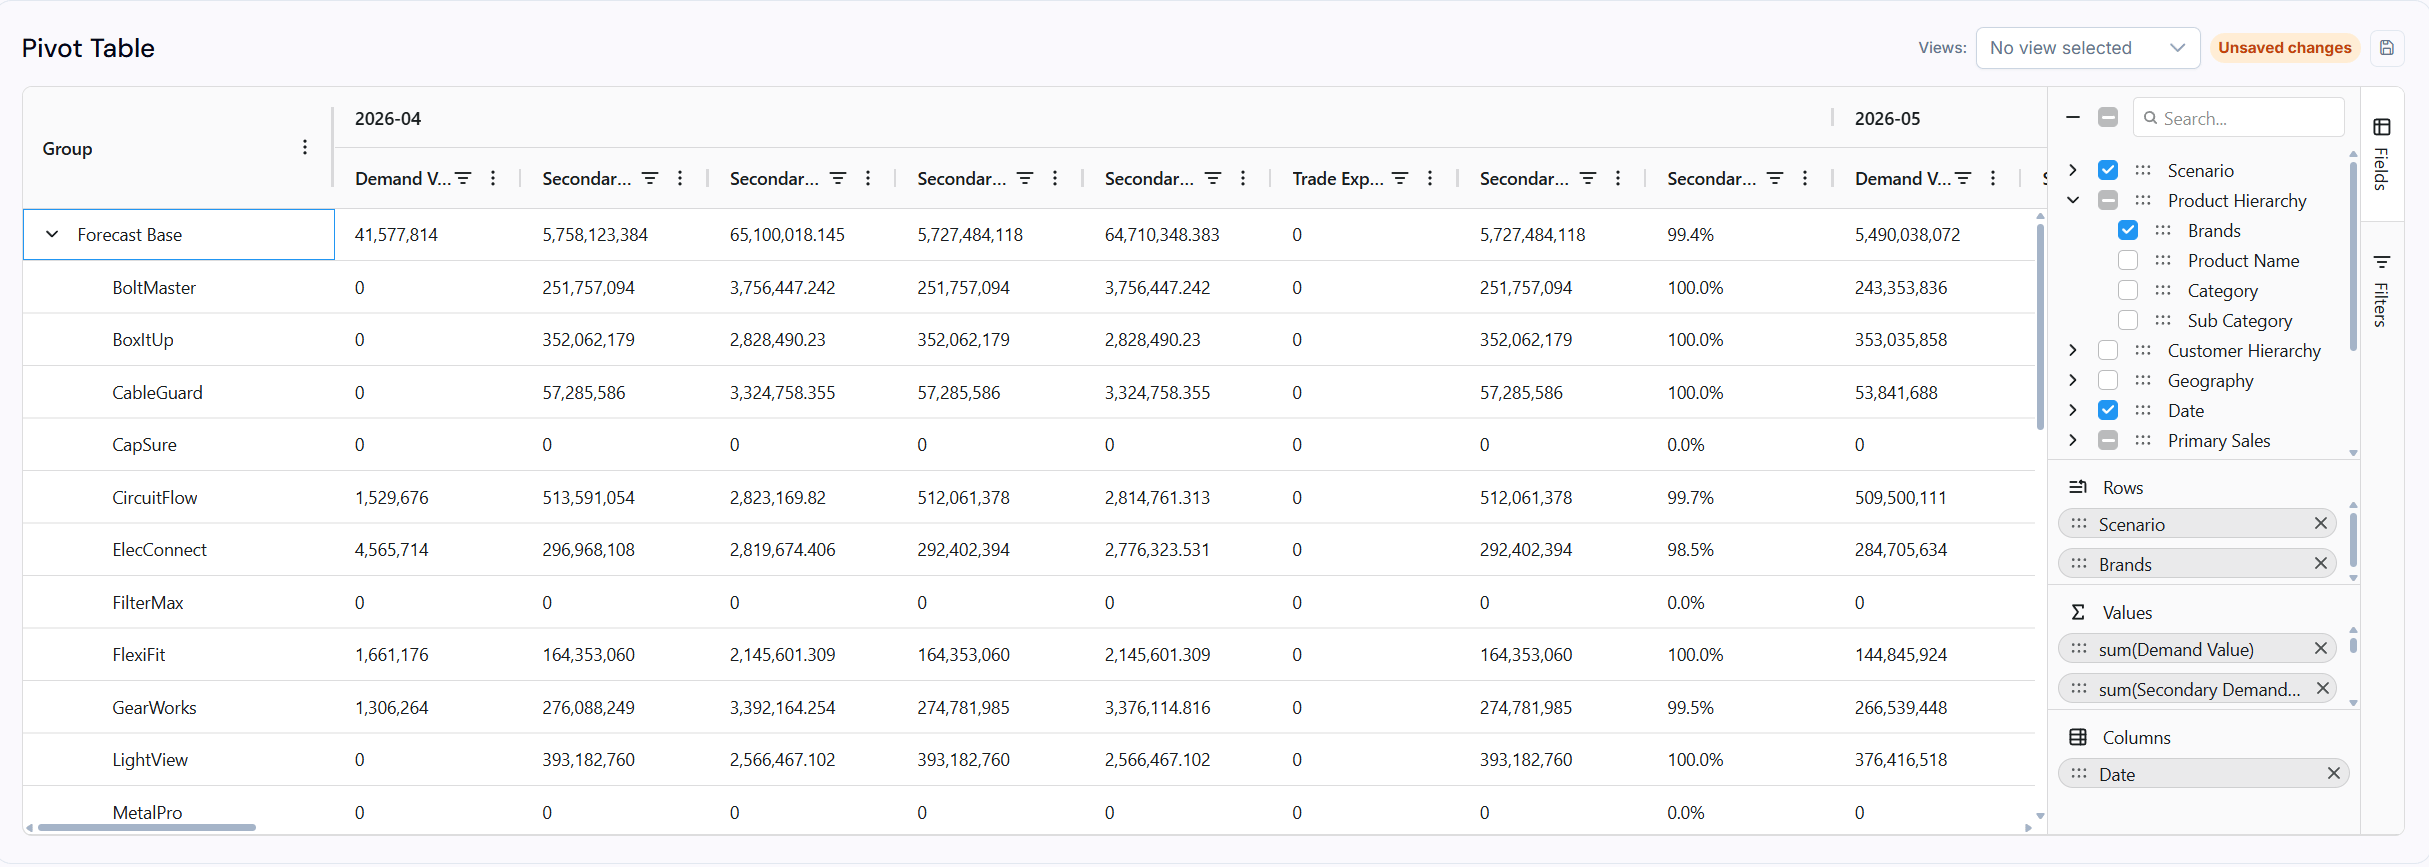
To access the Field List, click the **Fields** button on the right-side panel of the table.
### Customizable rows and columns
To access the Field List, click the **Fields** button on the right-side panel of the table.
 Select and drag-and-drop fields to arrange them dynamically as rows and columns.
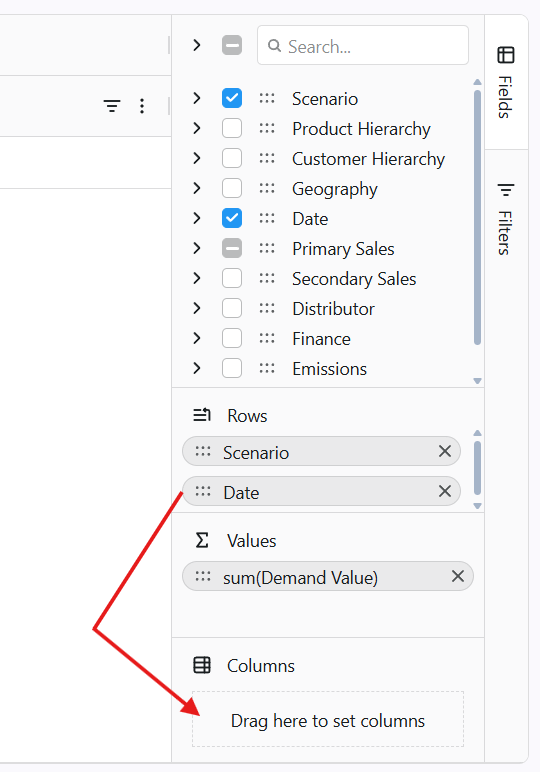 You can open the Field List settings to customize the visualization.
 ### Summarization options
The Pivot Table provides summary functions such as Sum, Average, Count, and Max/Min for numerical data.
### Summarization options
The Pivot Table provides summary functions such as Sum, Average, Count, and Max/Min for numerical data.
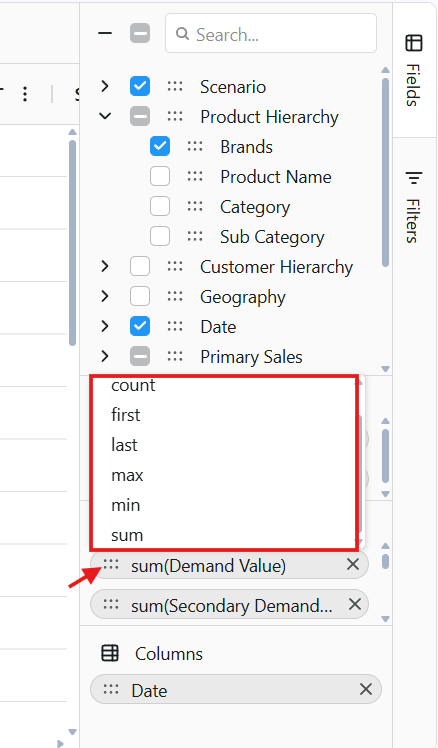 You can find the summary functions right next to each value field, directly in the Field List settings.
### Multi-level grouping
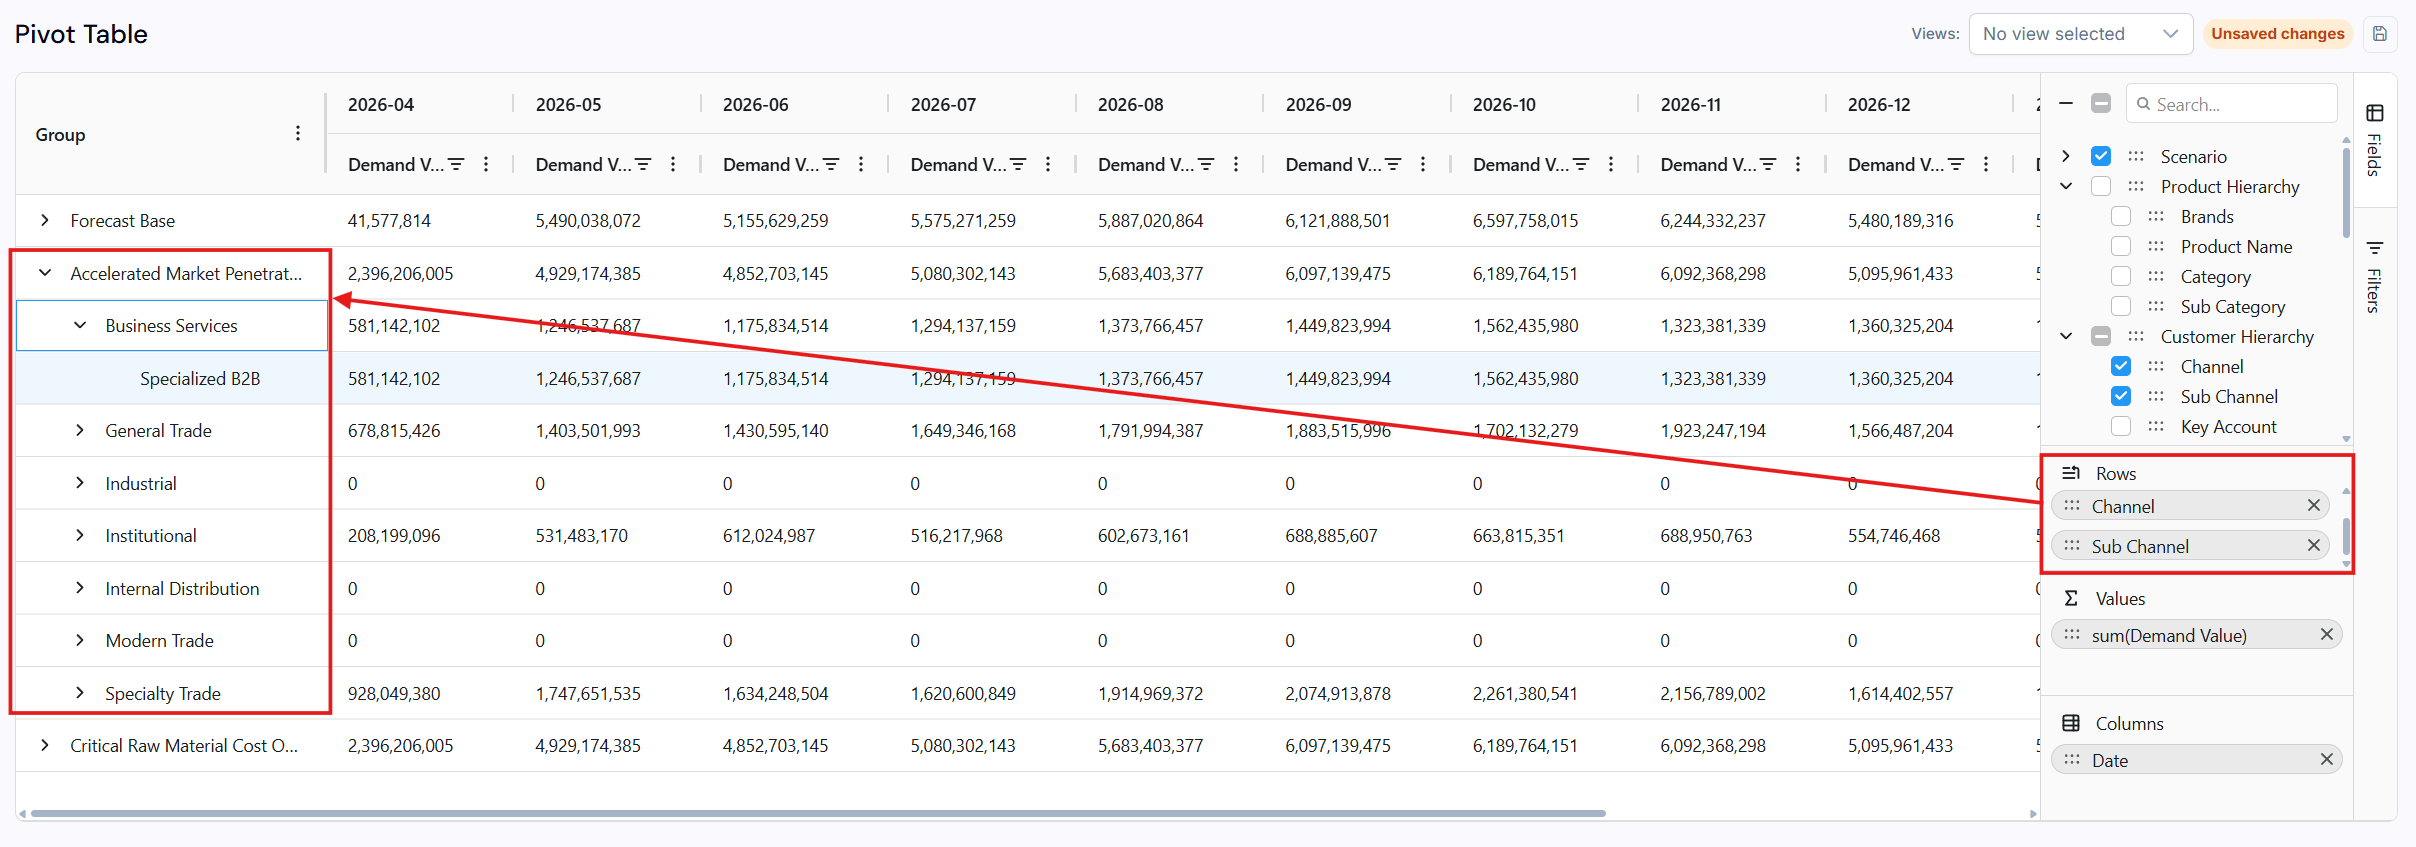
The Pivot Table supports hierarchical grouping (for example Channel > Sub Channel) by dragging and dropping fields within the Field List settings.
You can find the summary functions right next to each value field, directly in the Field List settings.
### Multi-level grouping
The Pivot Table supports hierarchical grouping (for example Channel > Sub Channel) by dragging and dropping fields within the Field List settings.
 ### Filtering and sorting
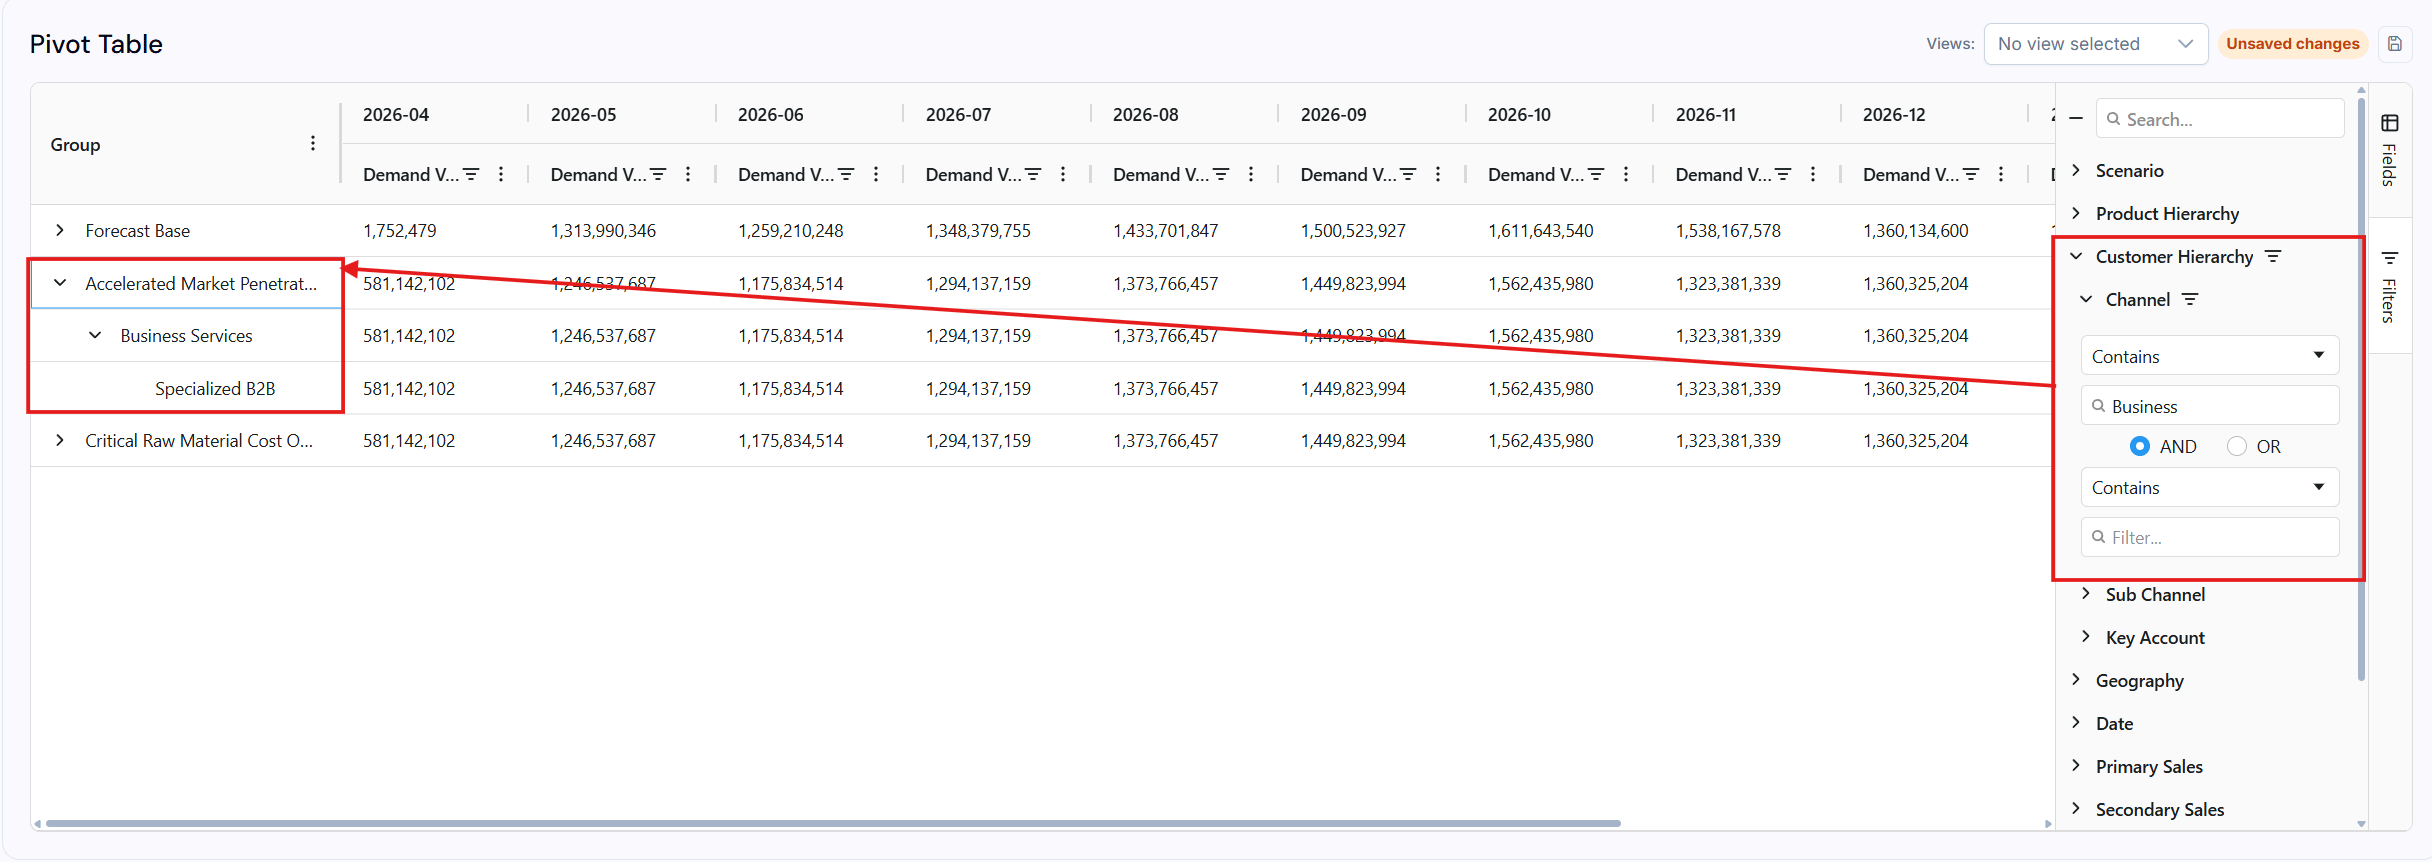
To access the filters, click the **Filters** button on the right-side panel of the table.
### Filtering and sorting
To access the filters, click the **Filters** button on the right-side panel of the table.
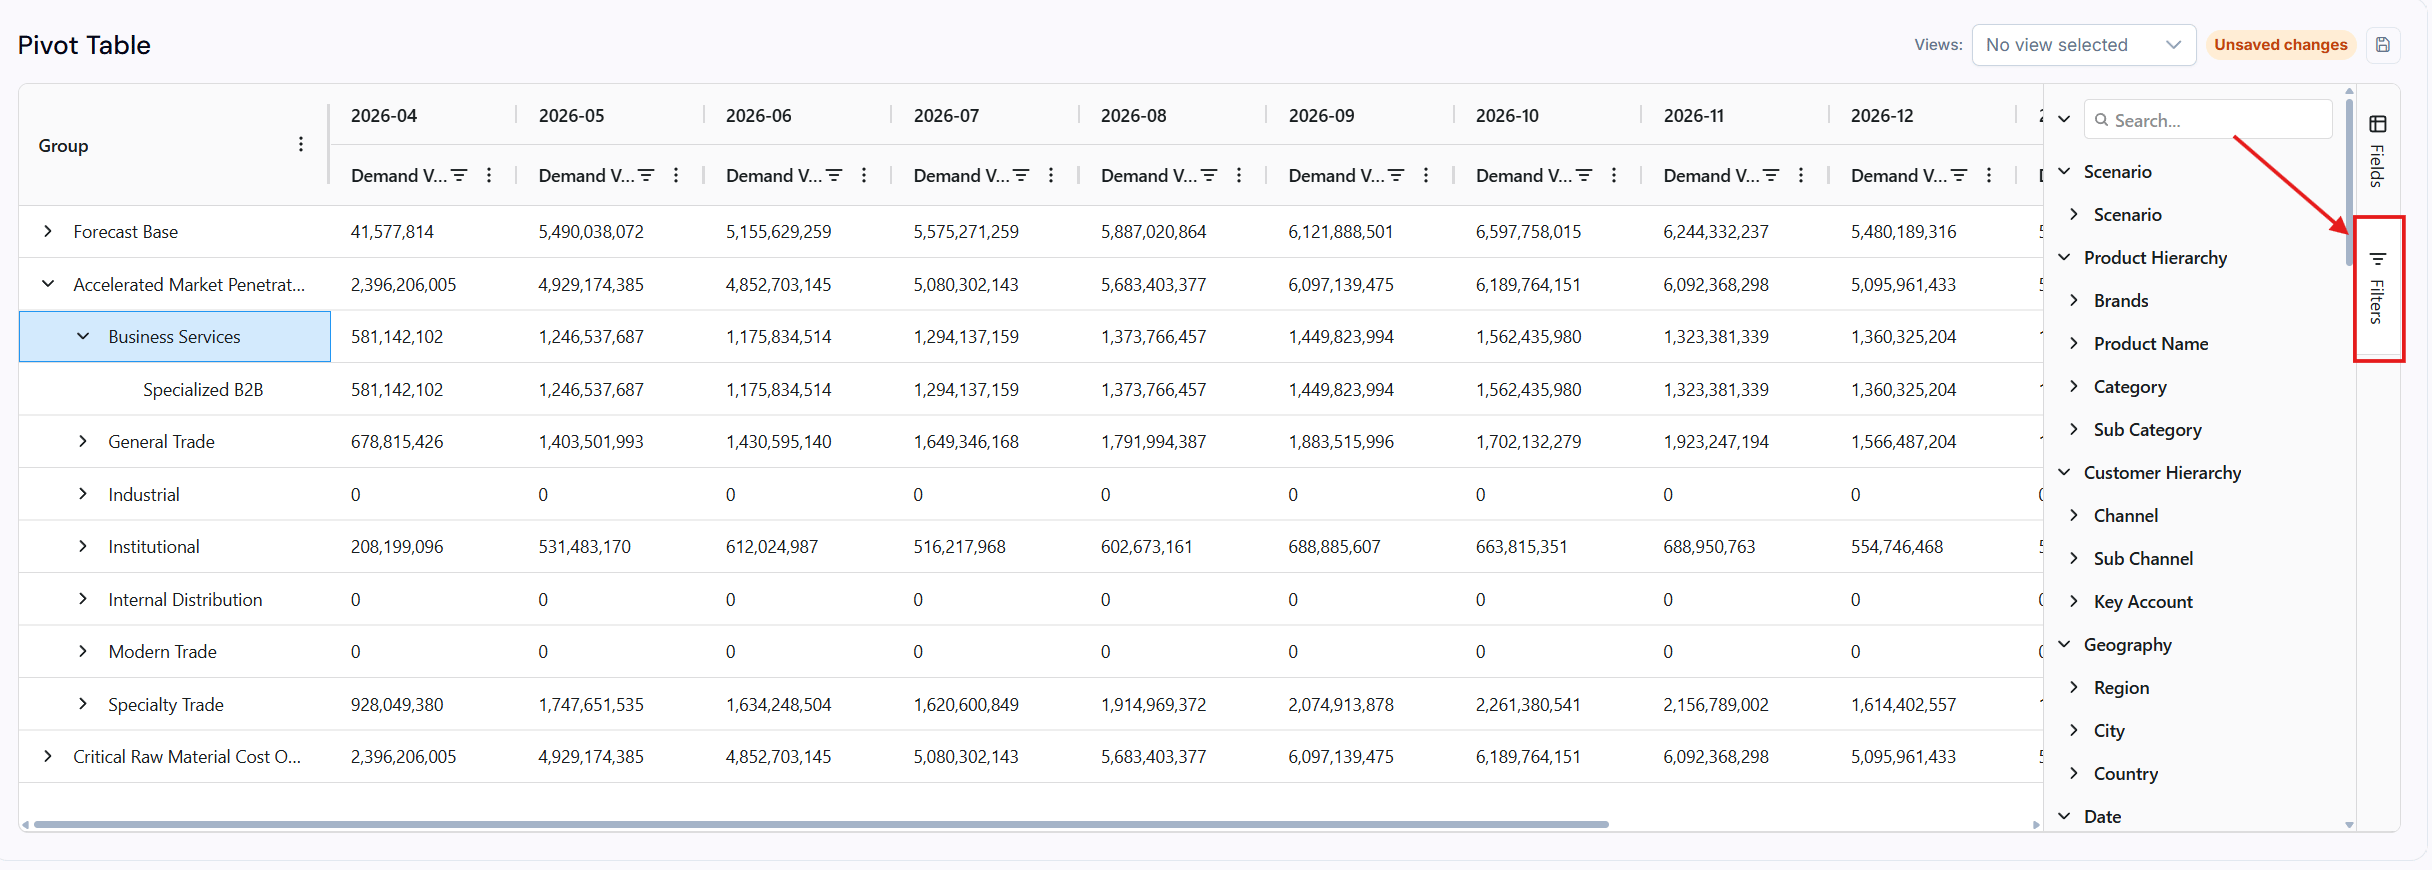 You can filter every field, such as the dataset and the columns, by value or alphabetical order.
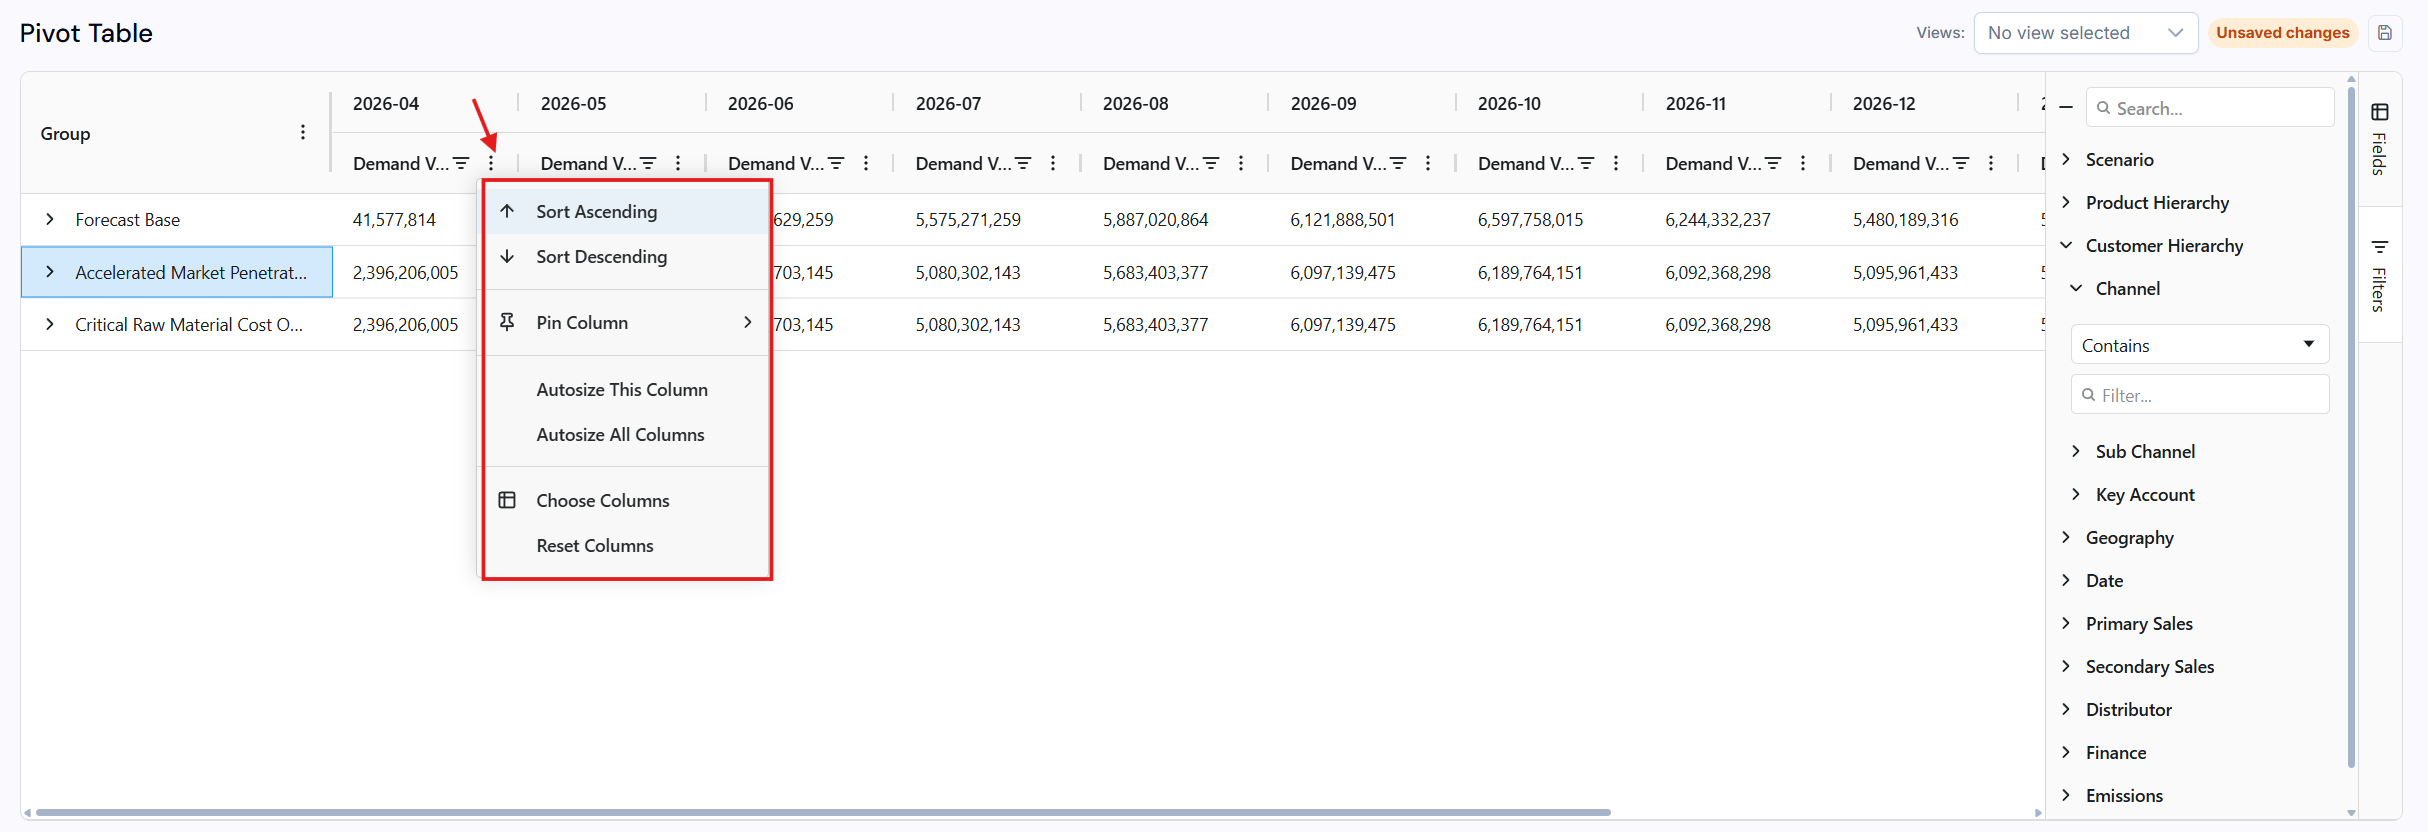
 You can reach the sort feature through the sorting icon right next to each field, directly in the pivot table.
 ### Drill-down capability
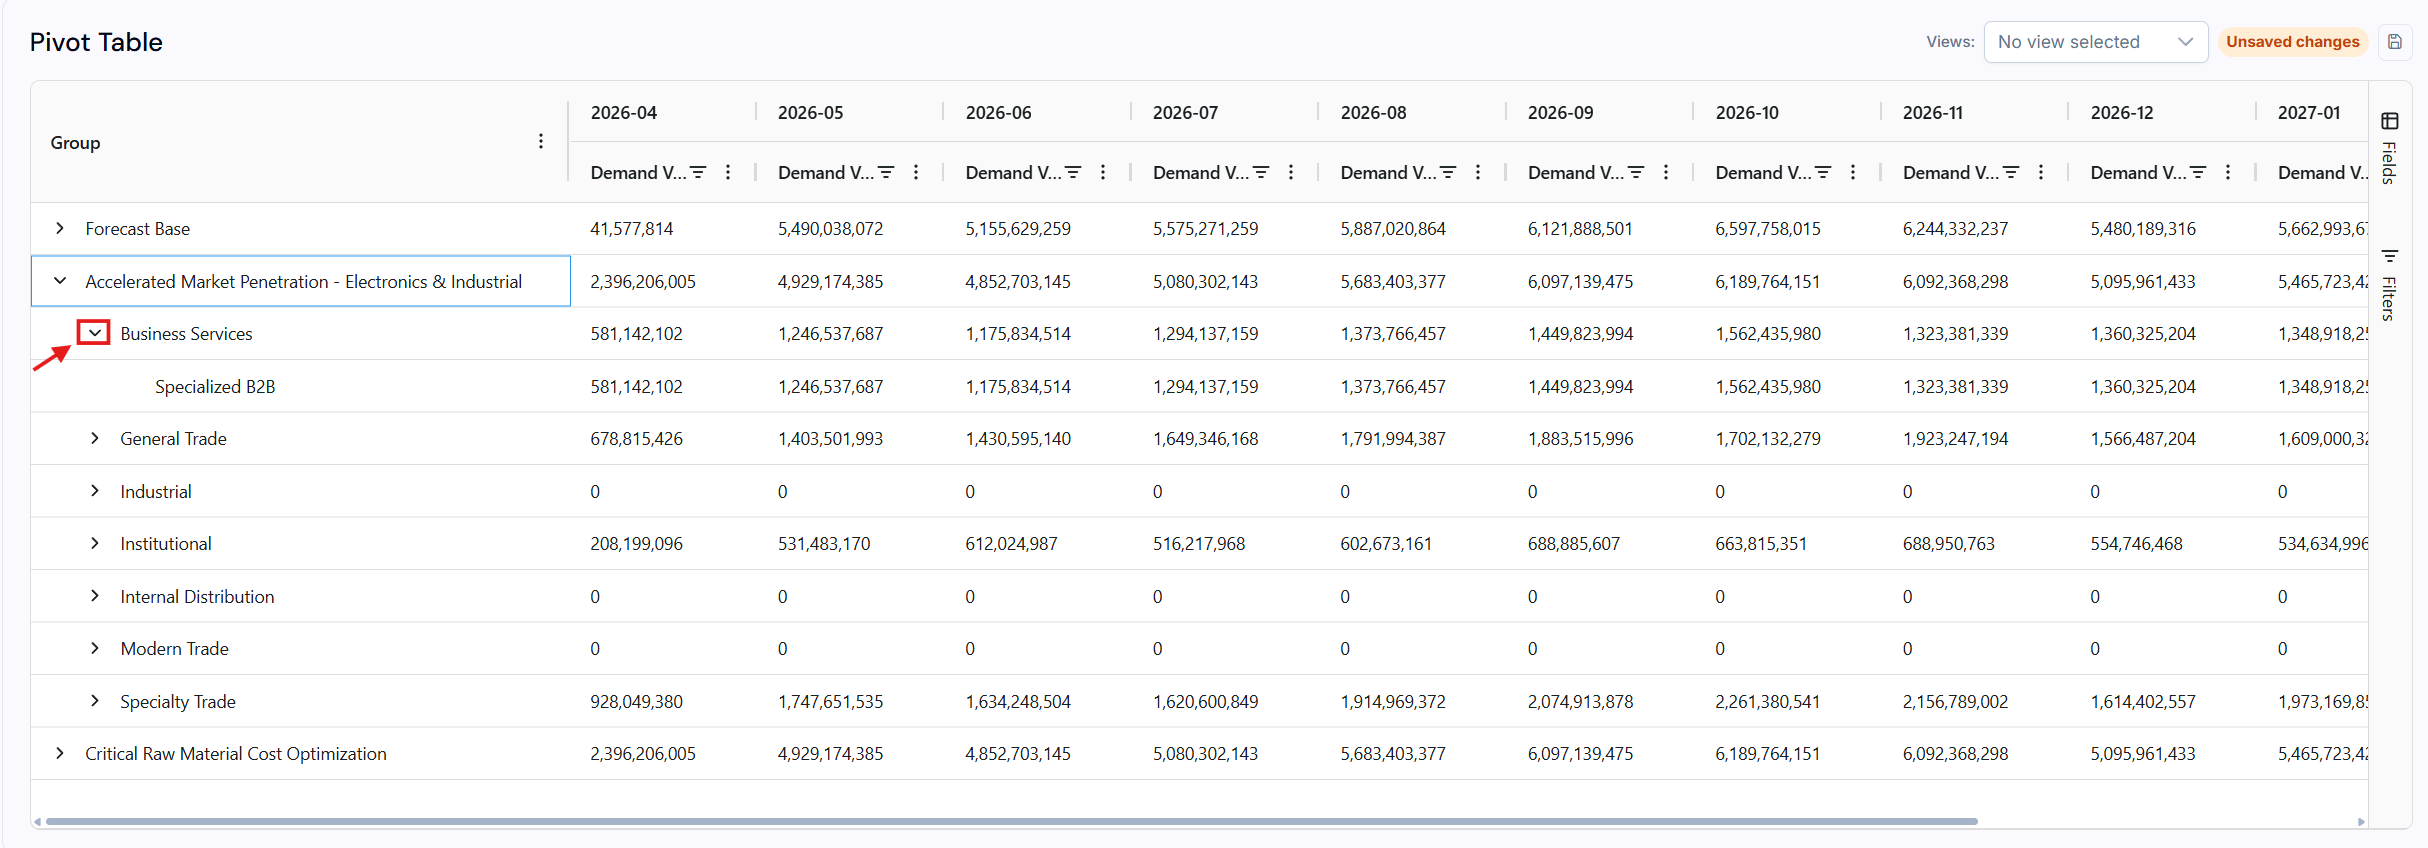
You can expand summary values to view the detailed underlying data. The drill-down function becomes accessible when there are at least 3 grouping fields.
### Drill-down capability
You can expand summary values to view the detailed underlying data. The drill-down function becomes accessible when there are at least 3 grouping fields.
 ### Save and load configurations
You can save customized pivot table configurations for reuse.
## Dimensions available
| Dimension | Drill-down levels |
| ------------ | ----------------------------------------------------- |
| **Product** | Name, Category, Range, Brand, Type, Strategic Segment |
| **Customer** | Name, Type, Channel, Region, City, Country |
| **Location** | Facility type (Factory, DC, Distributor, Customer) |
| **Time** | Month, Quarter, Half-year, Fiscal Year |
## Use cases
* **Profitability by customer channel** - Put Customer Channel on rows, profit KPIs as values
* **Demand by brand over time** - Put Brand on rows, Time on columns, Demand Value as the value
* **Cost breakdown by facility** - Put Location on rows, cost KPIs as values
* **Scenario comparison** - Put Scenario on columns to compare all KPIs across planning scenarios
### Save and load configurations
You can save customized pivot table configurations for reuse.
## Dimensions available
| Dimension | Drill-down levels |
| ------------ | ----------------------------------------------------- |
| **Product** | Name, Category, Range, Brand, Type, Strategic Segment |
| **Customer** | Name, Type, Channel, Region, City, Country |
| **Location** | Facility type (Factory, DC, Distributor, Customer) |
| **Time** | Month, Quarter, Half-year, Fiscal Year |
## Use cases
* **Profitability by customer channel** - Put Customer Channel on rows, profit KPIs as values
* **Demand by brand over time** - Put Brand on rows, Time on columns, Demand Value as the value
* **Cost breakdown by facility** - Put Location on rows, cost KPIs as values
* **Scenario comparison** - Put Scenario on columns to compare all KPIs across planning scenarios