> ## Documentation Index
> Fetch the complete documentation index at: https://docs.simcel.io/llms.txt
> Use this file to discover all available pages before exploring further.
# Plan realization
> Compare any mix of datasets across a full fiscal year, with Year-to-Date and Year-to-Go breakdowns.
The Plan Realization report lets you compare any mix of datasets selected in the plan over an entire fiscal year and its Year-to-Date (YTD) and Year-to-Go (YTG) periods. It helps you identify gaps, assess plan adherence, and evaluate variances.
To access this tool, click **Plan Realization** under the Tools section on the left-side panel.
 ## Key features
### Display controls
## Key features
### Display controls
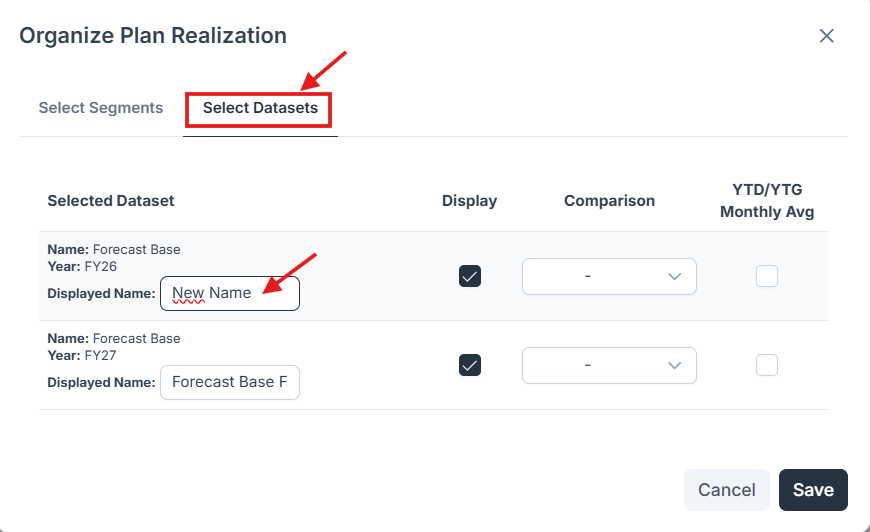
 **Rename dataset columns**
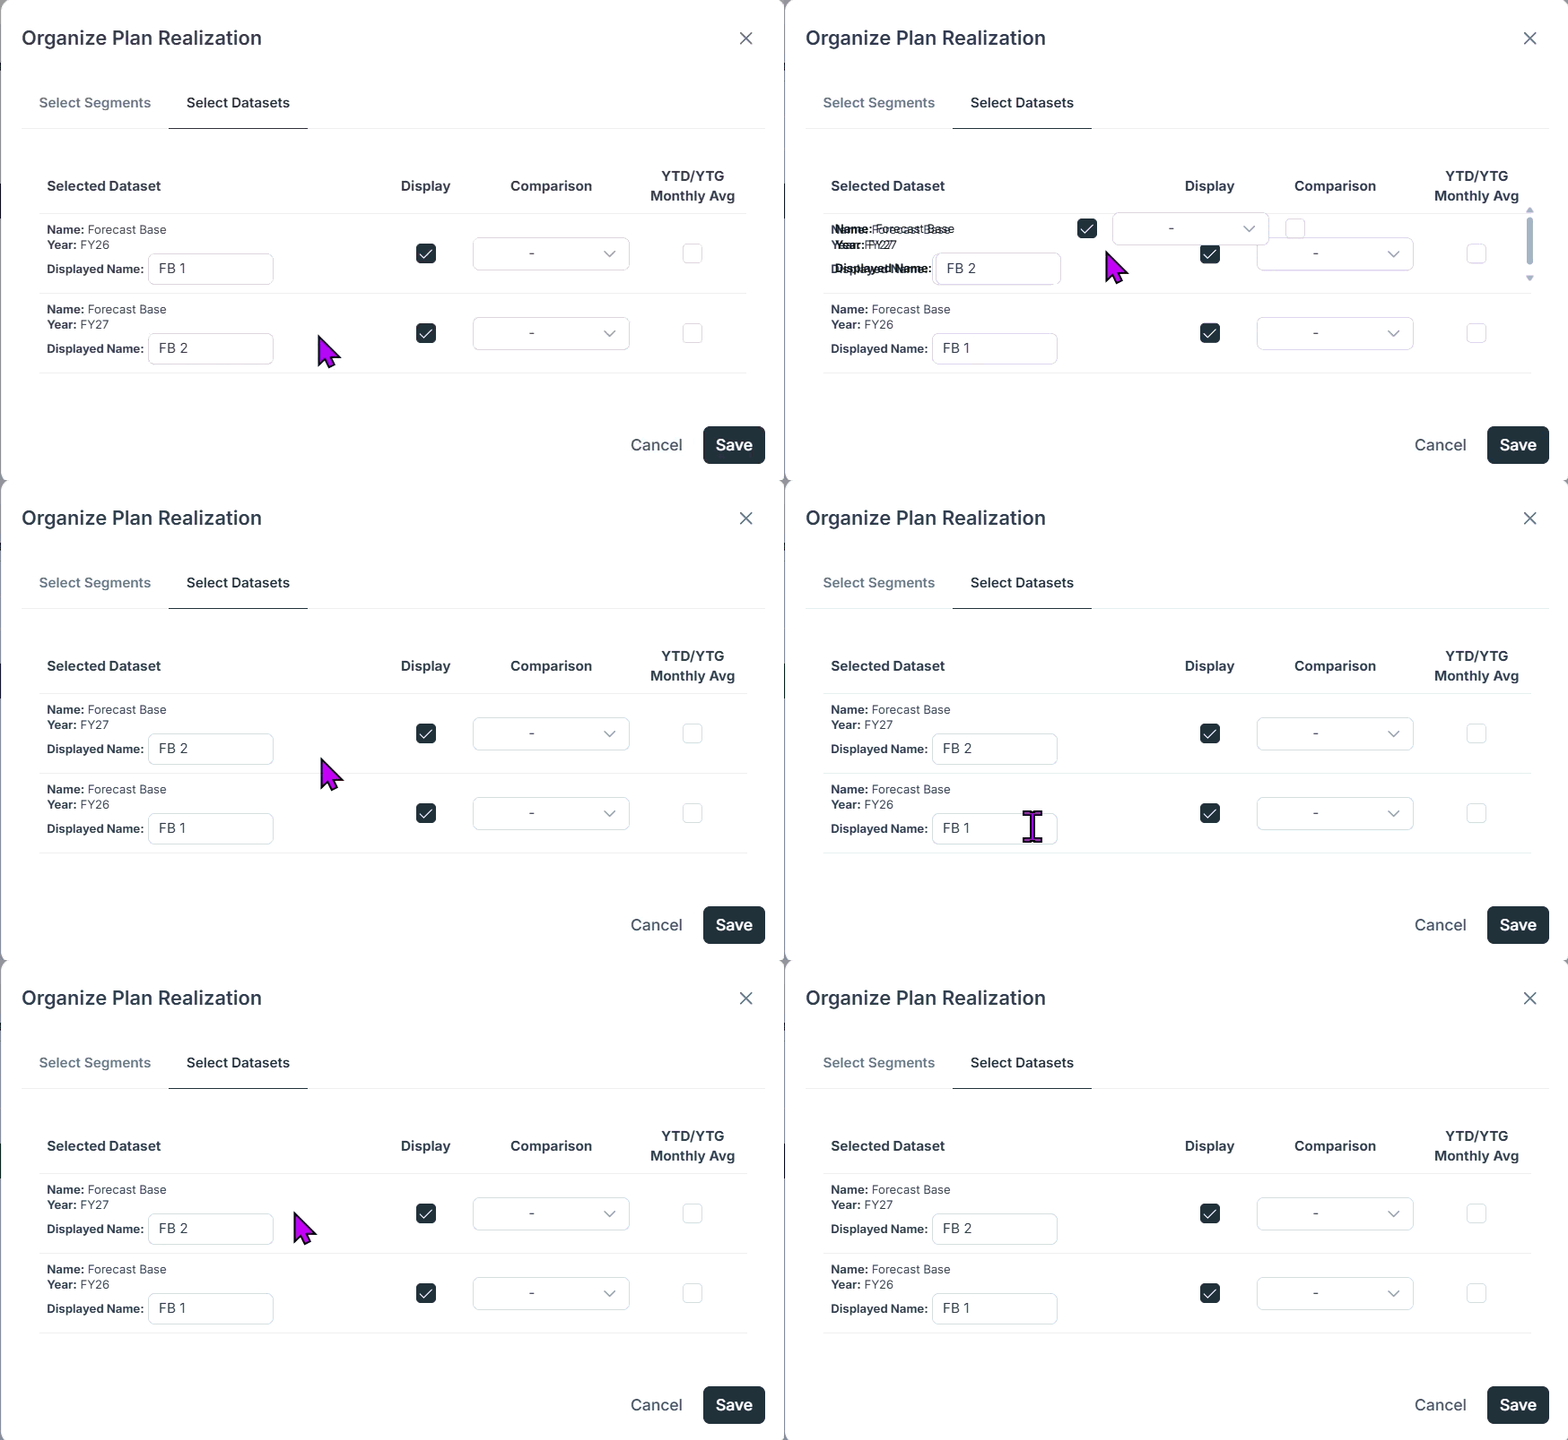
 **Drag-and-drop to reorder**
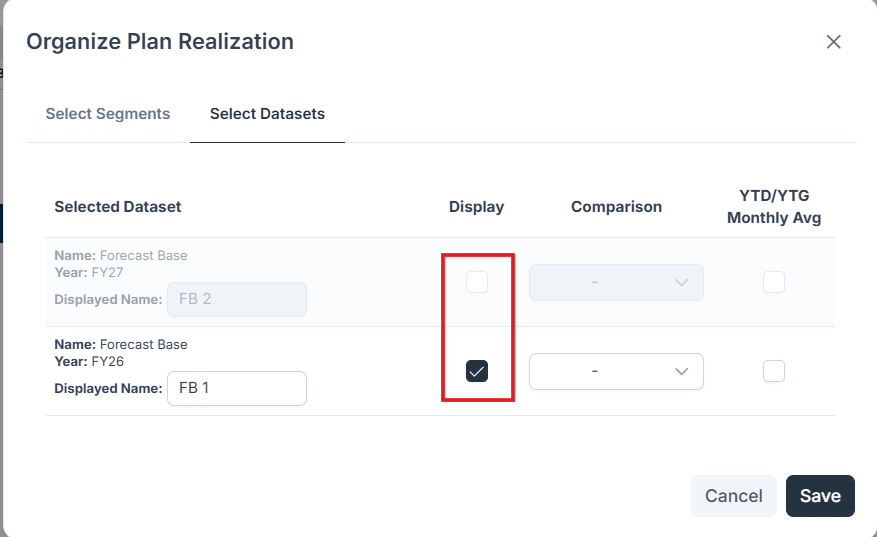
 **Hide/show columns**
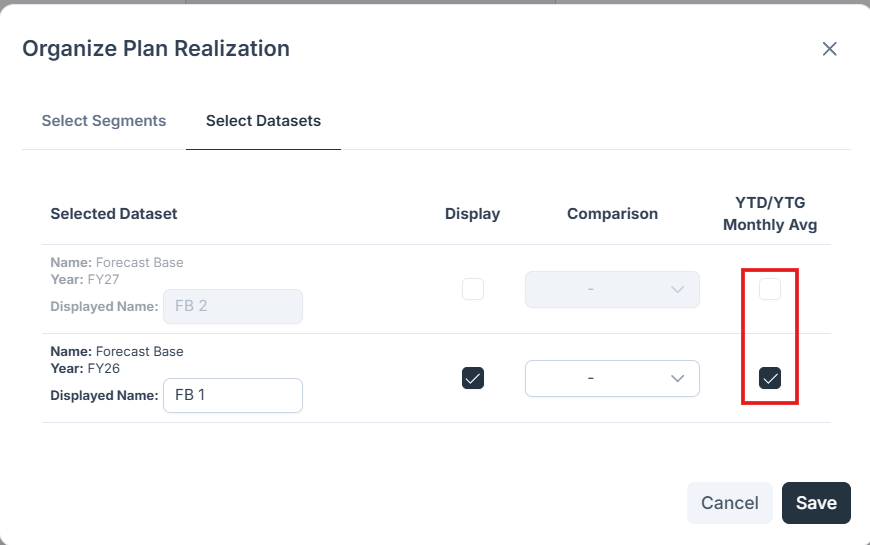
 **Hide/show Average YTD/YTG month blocks**
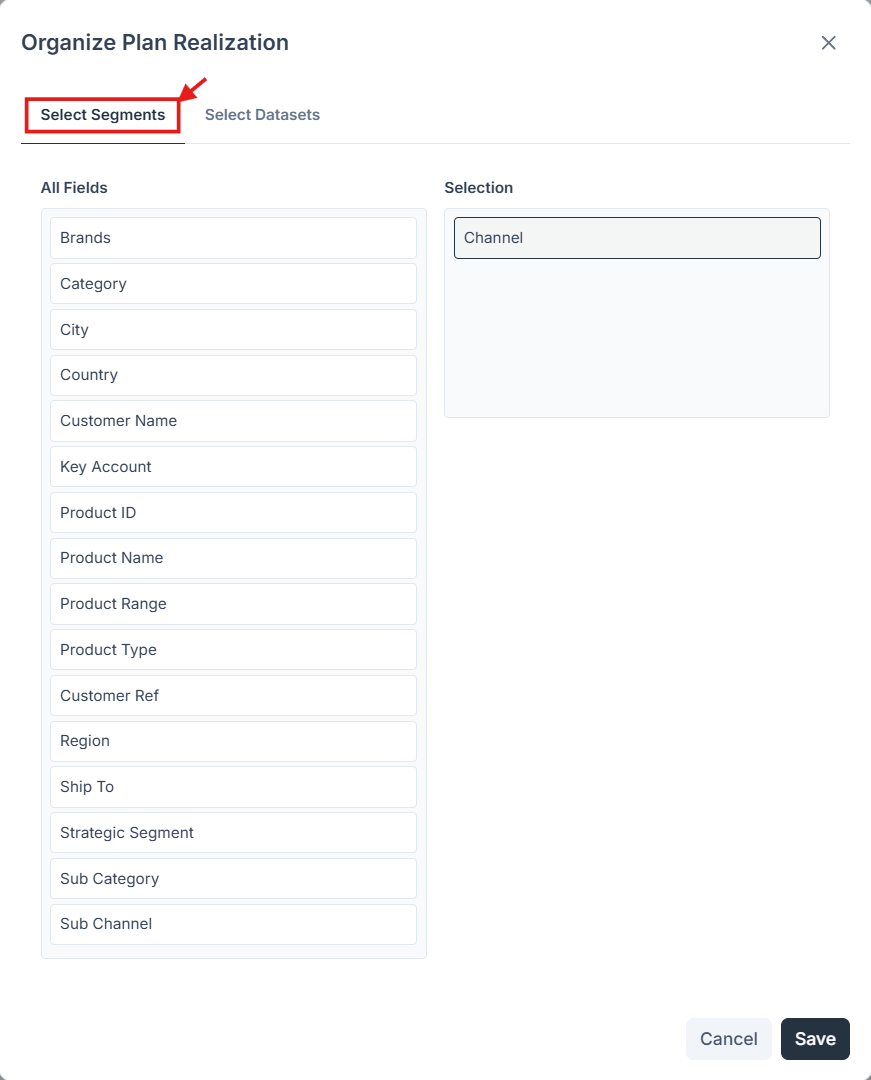
 **Choose segment hierarchy**
 ### Summary insights
* FY total, YTD total, and YTG total
* Monthly averages for YTD and YTG
* YTD vs. YTG gap in value and percentage
### Summary insights
* FY total, YTD total, and YTG total
* Monthly averages for YTD and YTG
* YTD vs. YTG gap in value and percentage
 ### Period logic
| Period | Definition |
| ------- | ---------------------------------------------------------------------------- |
| **FY** | Set based on the workspace (for example, from January to December) |
| **YTD** | From the FY start month (for example, January) to the plan's start month - 1 |
| **YTG** | From the plan's start month to the FY end month (for example, December) |
In this widget, the plan's start month is applied for every fiscal year available when calculating all the YTD/YTG periods.
**Automatic full-year stitching**: Where a selected dataset has no value for the past period, the report auto-fills with the Actual or Last Plan value.
### Comparison engine
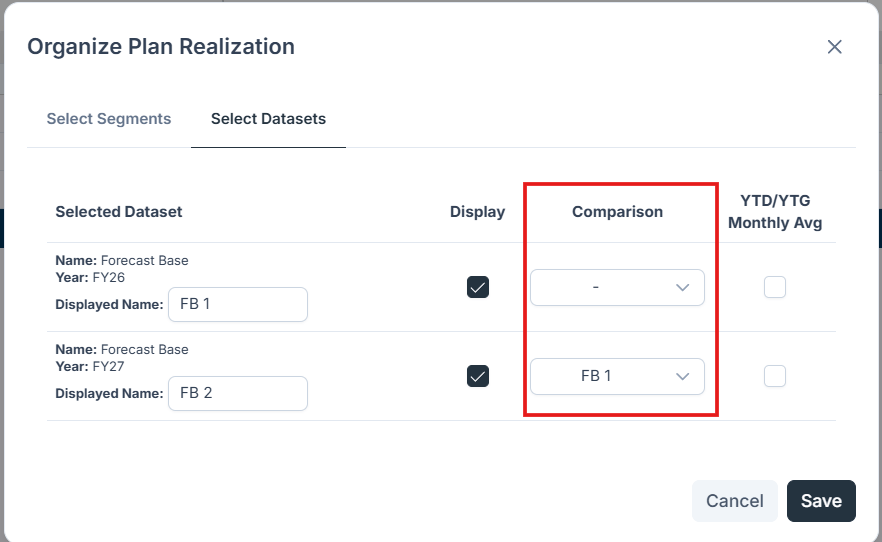
The report shows the absolute and percentage variances between the displayed and referenced datasets, so you can quickly see where you are on track, where you are at risk, and the magnitude and direction of each deviation.
### Period logic
| Period | Definition |
| ------- | ---------------------------------------------------------------------------- |
| **FY** | Set based on the workspace (for example, from January to December) |
| **YTD** | From the FY start month (for example, January) to the plan's start month - 1 |
| **YTG** | From the plan's start month to the FY end month (for example, December) |
In this widget, the plan's start month is applied for every fiscal year available when calculating all the YTD/YTG periods.
**Automatic full-year stitching**: Where a selected dataset has no value for the past period, the report auto-fills with the Actual or Last Plan value.
### Comparison engine
The report shows the absolute and percentage variances between the displayed and referenced datasets, so you can quickly see where you are on track, where you are at risk, and the magnitude and direction of each deviation.
 Combine Plan Realization insights with Forecast Accuracy data to understand whether gaps are due to forecasting errors or execution issues.