
.svg?fit=max&auto=format&n=NwcmN3Uz2rKt7z_Z&q=85&s=5062a9f3b73c4eb9710e4e28d530d3dd)
- Breakdown of components: Shows the incremental effect of each component on the final net income.
- Visualizing contributions: Distinguishes between positive contributions (revenues) and negative contributions (costs and expenses) to the overall financial outcome.
- Facilitating decision making: Isolates and visualizes the impact of individual P&L components.
- Performance comparison: Compares various scenarios to identify variances.
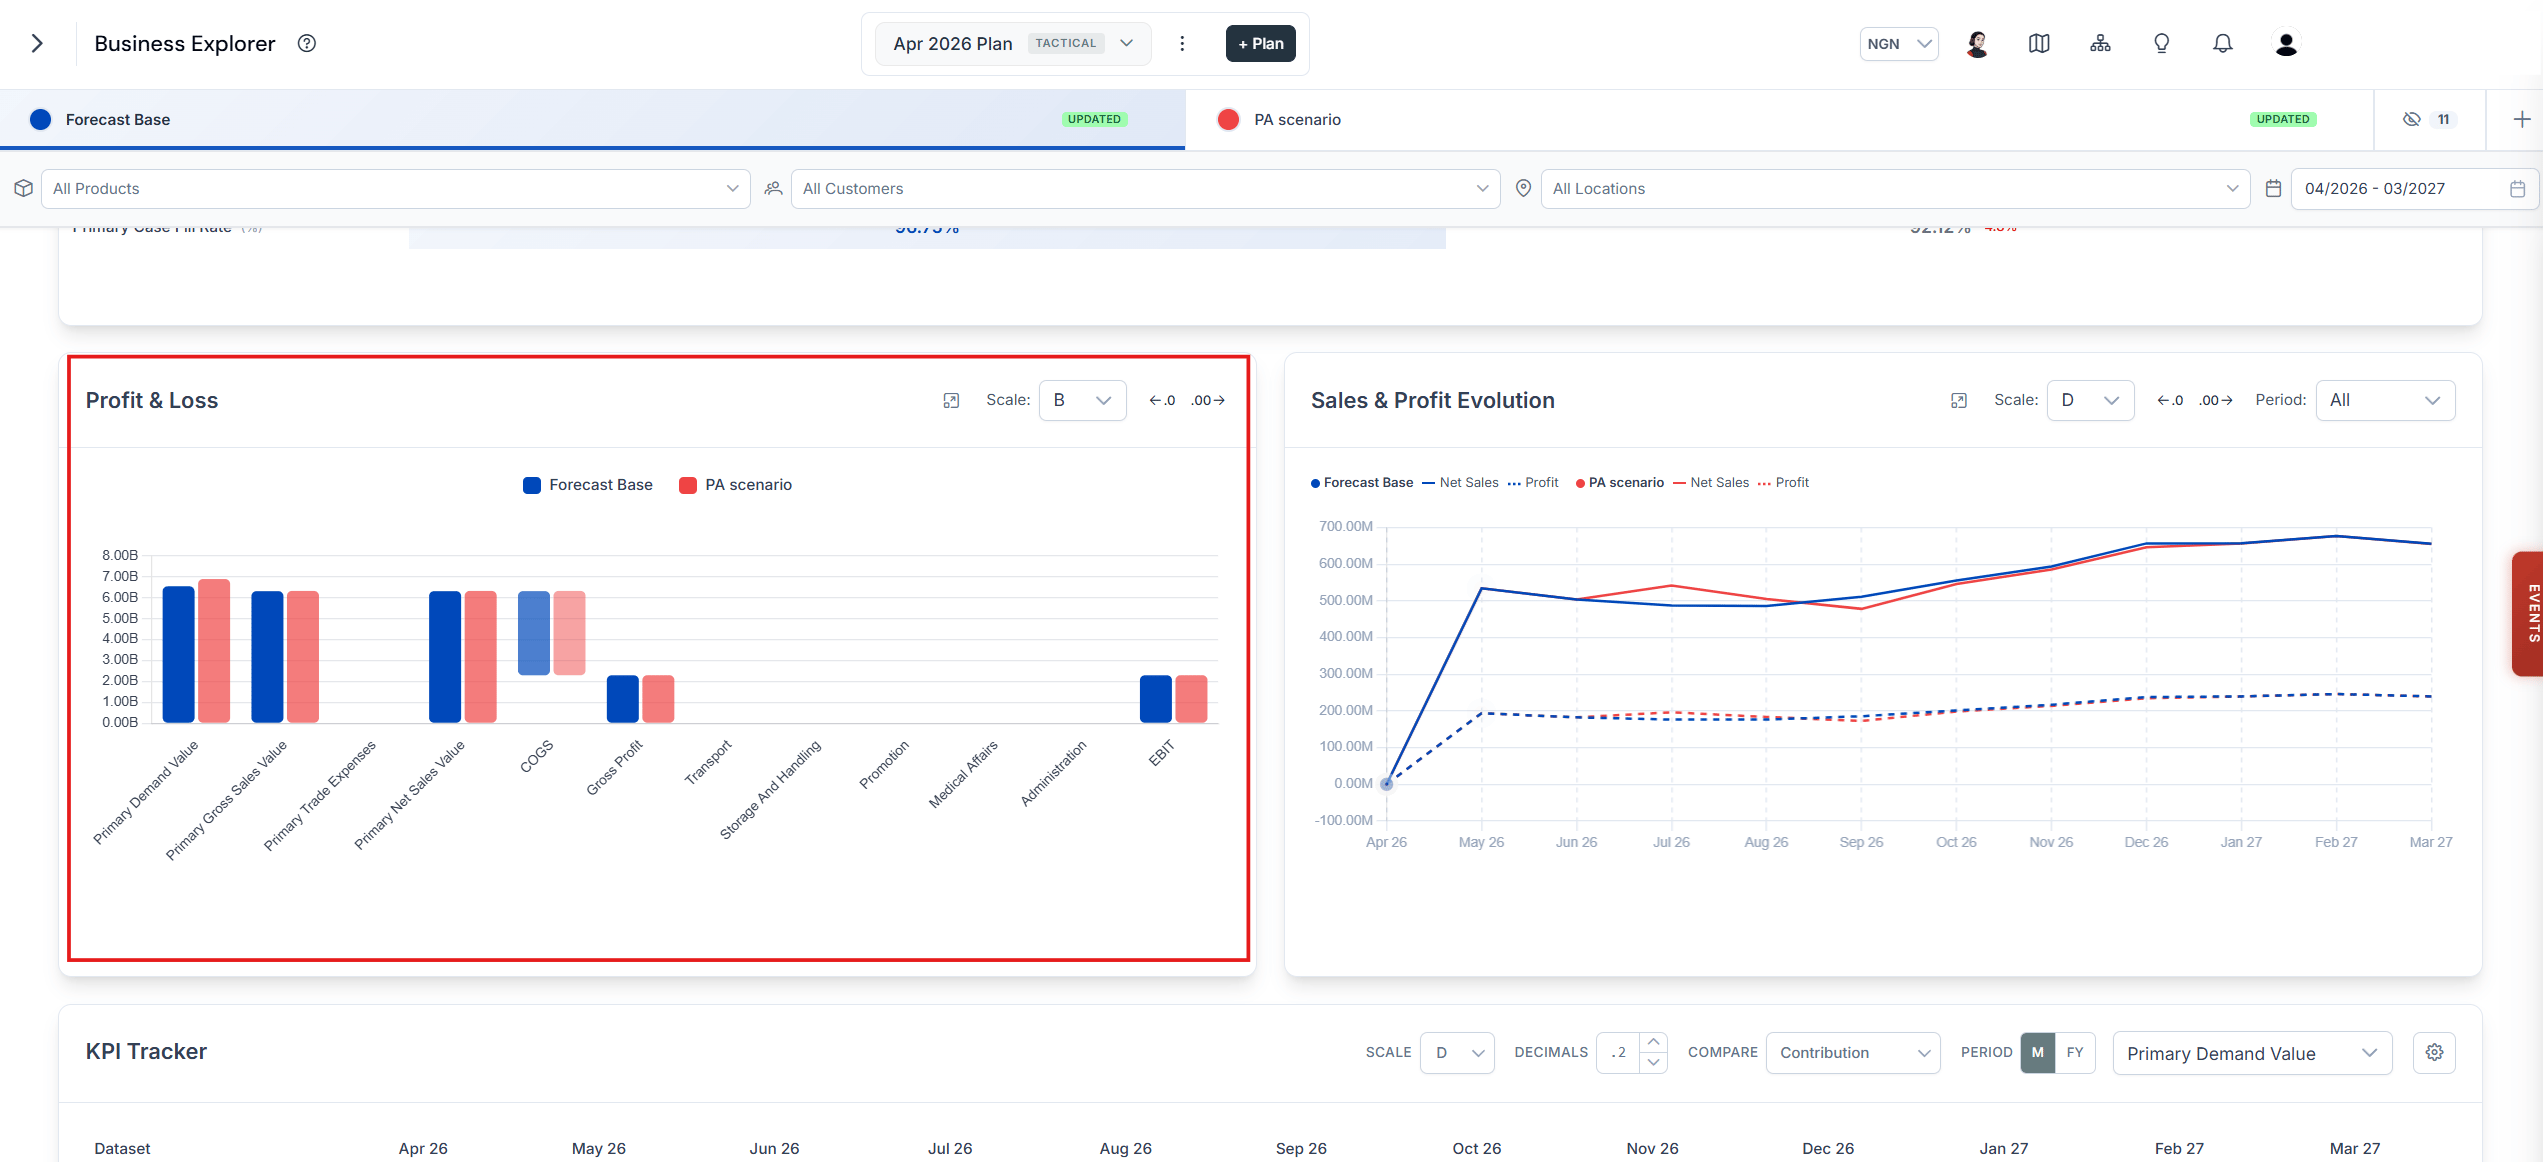
The P&L Waterfall widget in the Business Explorer
P&L structure
SIMCEL cascades financial KPIs down this waterfall:Scenario comparison
The Business Explorer highlights differences between scenarios using color coding:- Green — favorable movement (higher revenue, lower costs)
- Red — unfavorable movement (lower revenue, higher costs)
Full screen view
To enable the full screen view for this widget, click the full screen button.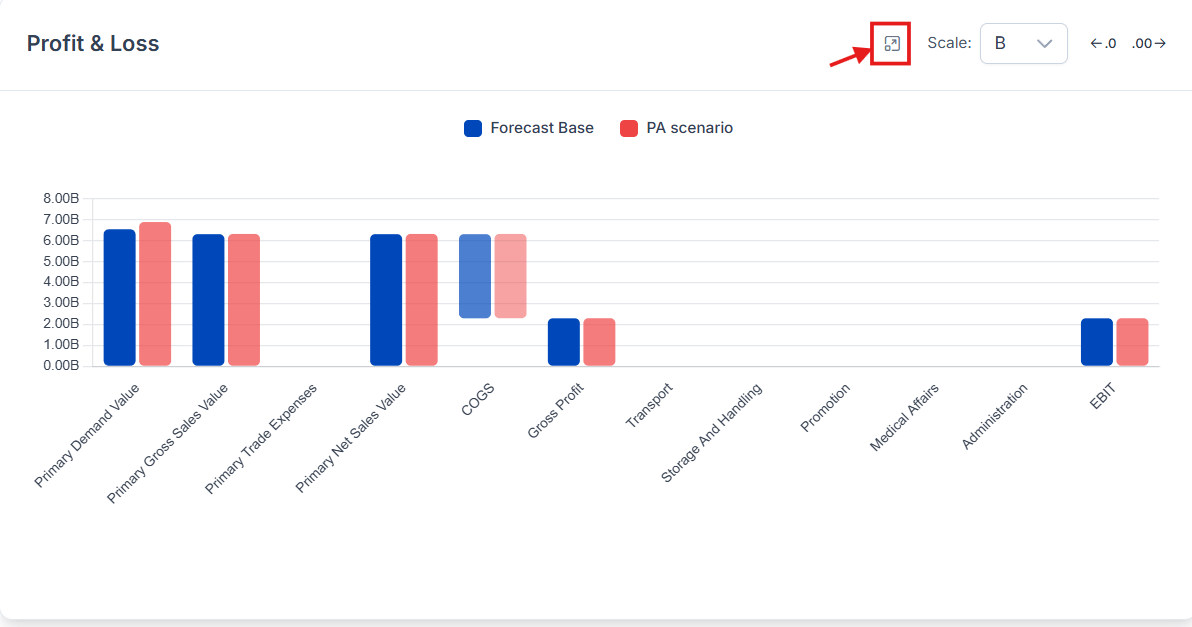
The full screen button on the P&L Waterfall widget