
.svg?fit=max&auto=format&n=NwcmN3Uz2rKt7z_Z&q=85&s=5062a9f3b73c4eb9710e4e28d530d3dd)
This section gives demand planners advanced, flexible analytics tools for the demand planning process, improving your capacity to analyze demand data across different periods and business segments.
Select datasets to display as data series
You can display many datasets as data series at the same time, so you can analyze the different data dimensions that are relevant to your planning. Click Add Dataset, then select the specific data series you want to show. In the illustration below, the user is displaying Base Demand.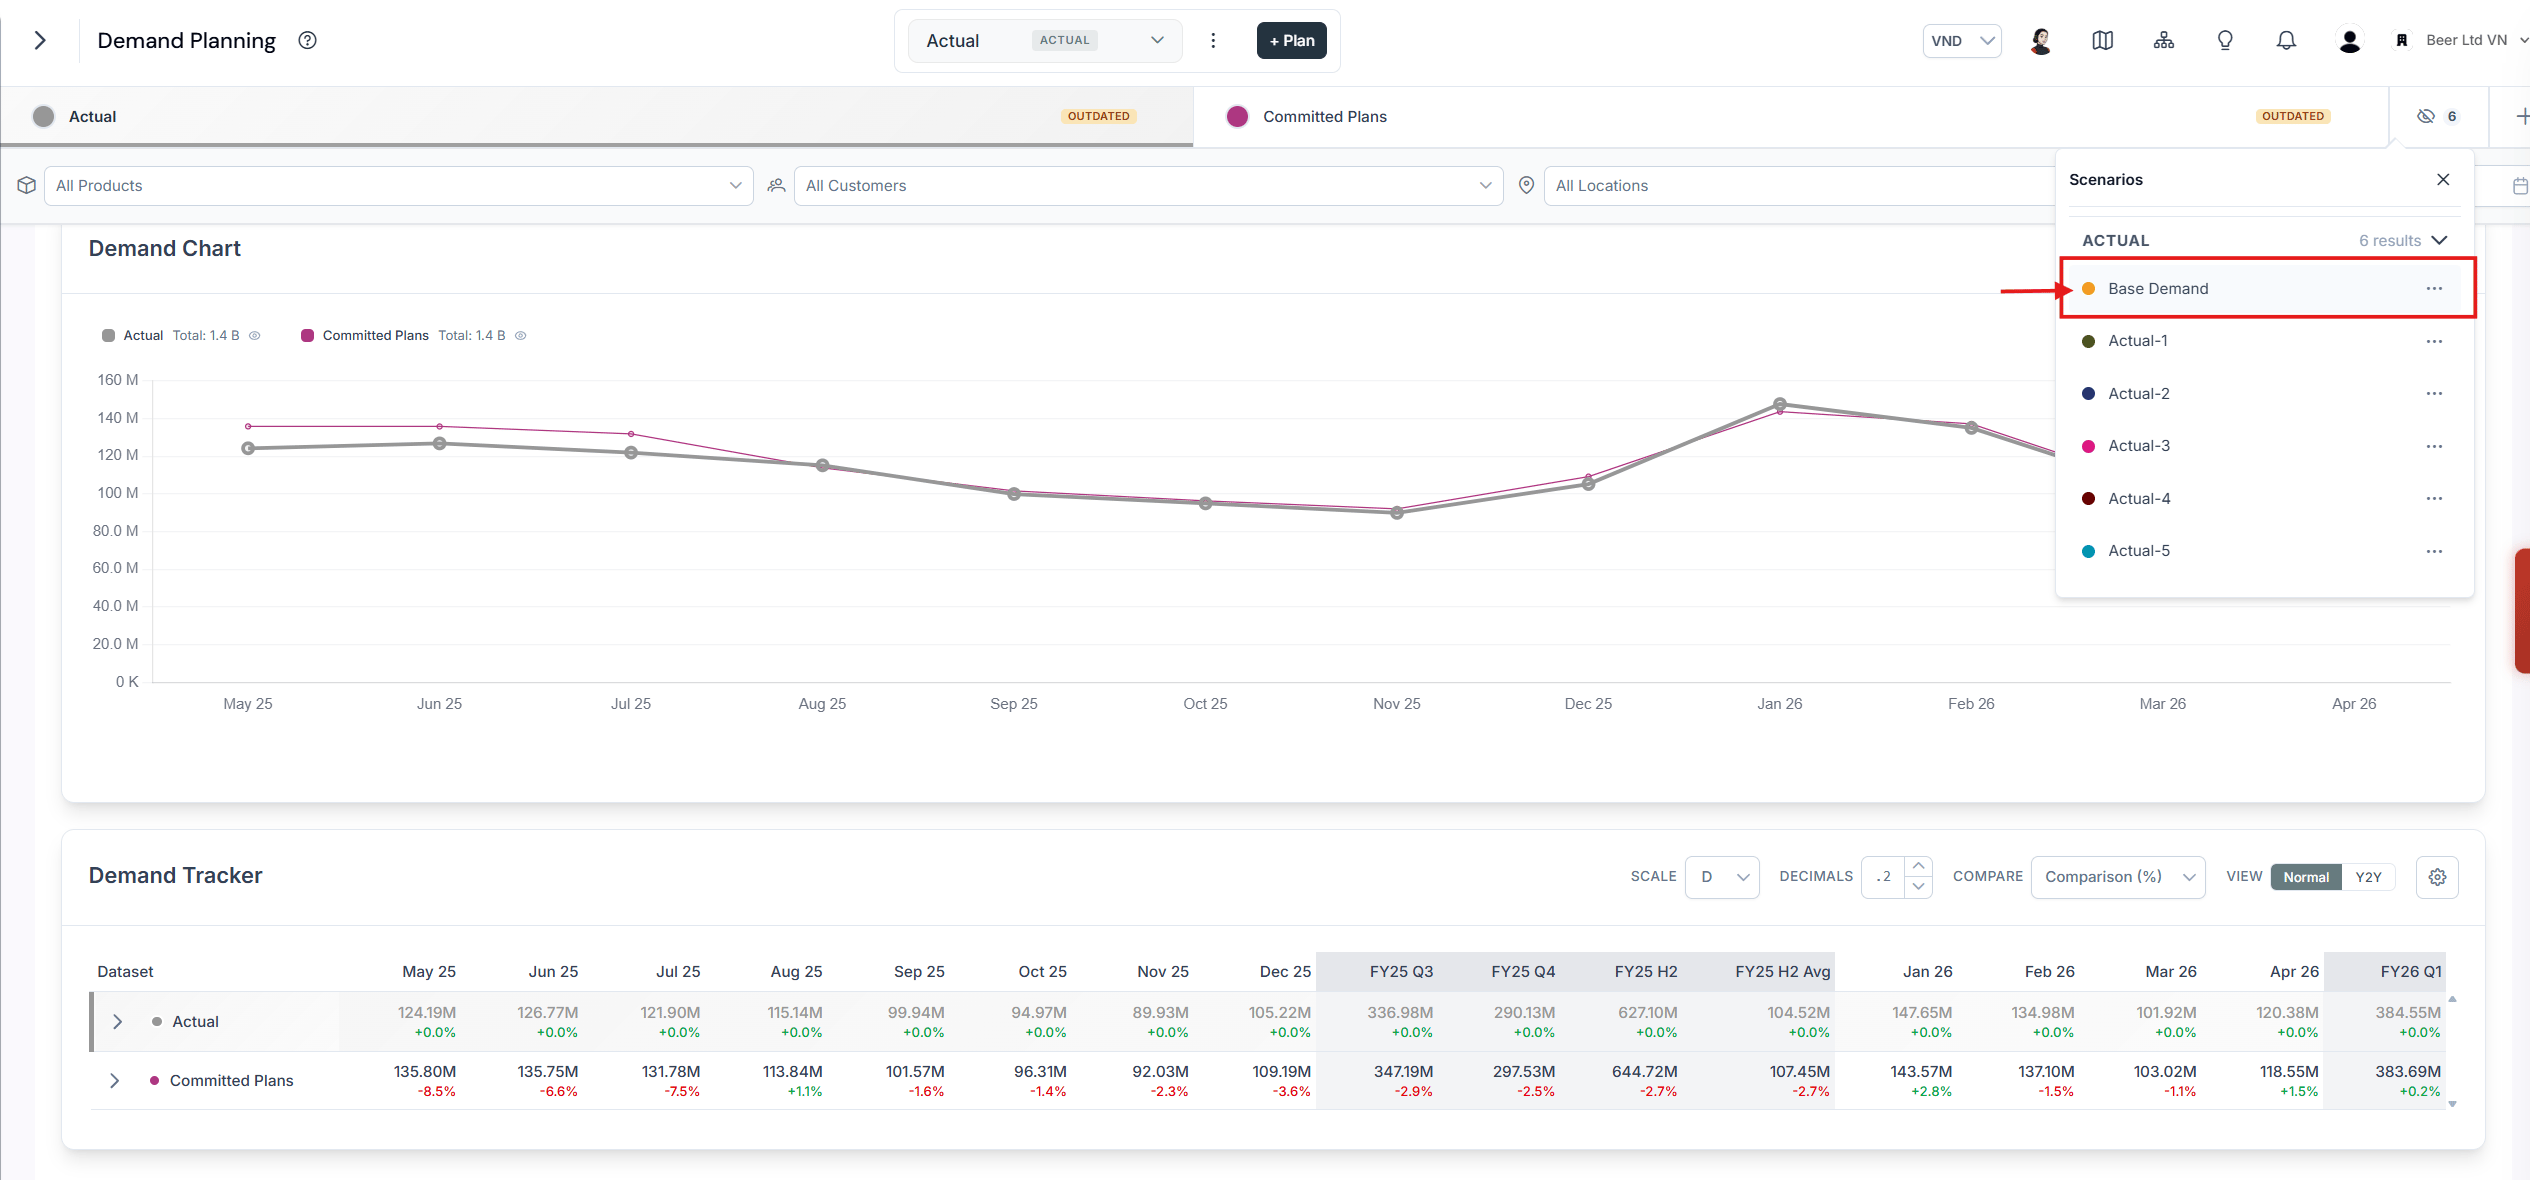
Adding a dataset as a data series
Select a color per dataset
You can set a new color per dataset, except for Actual, Committed, and Last Plan, so you can visually distinguish between the different data series in the analytics charts and table.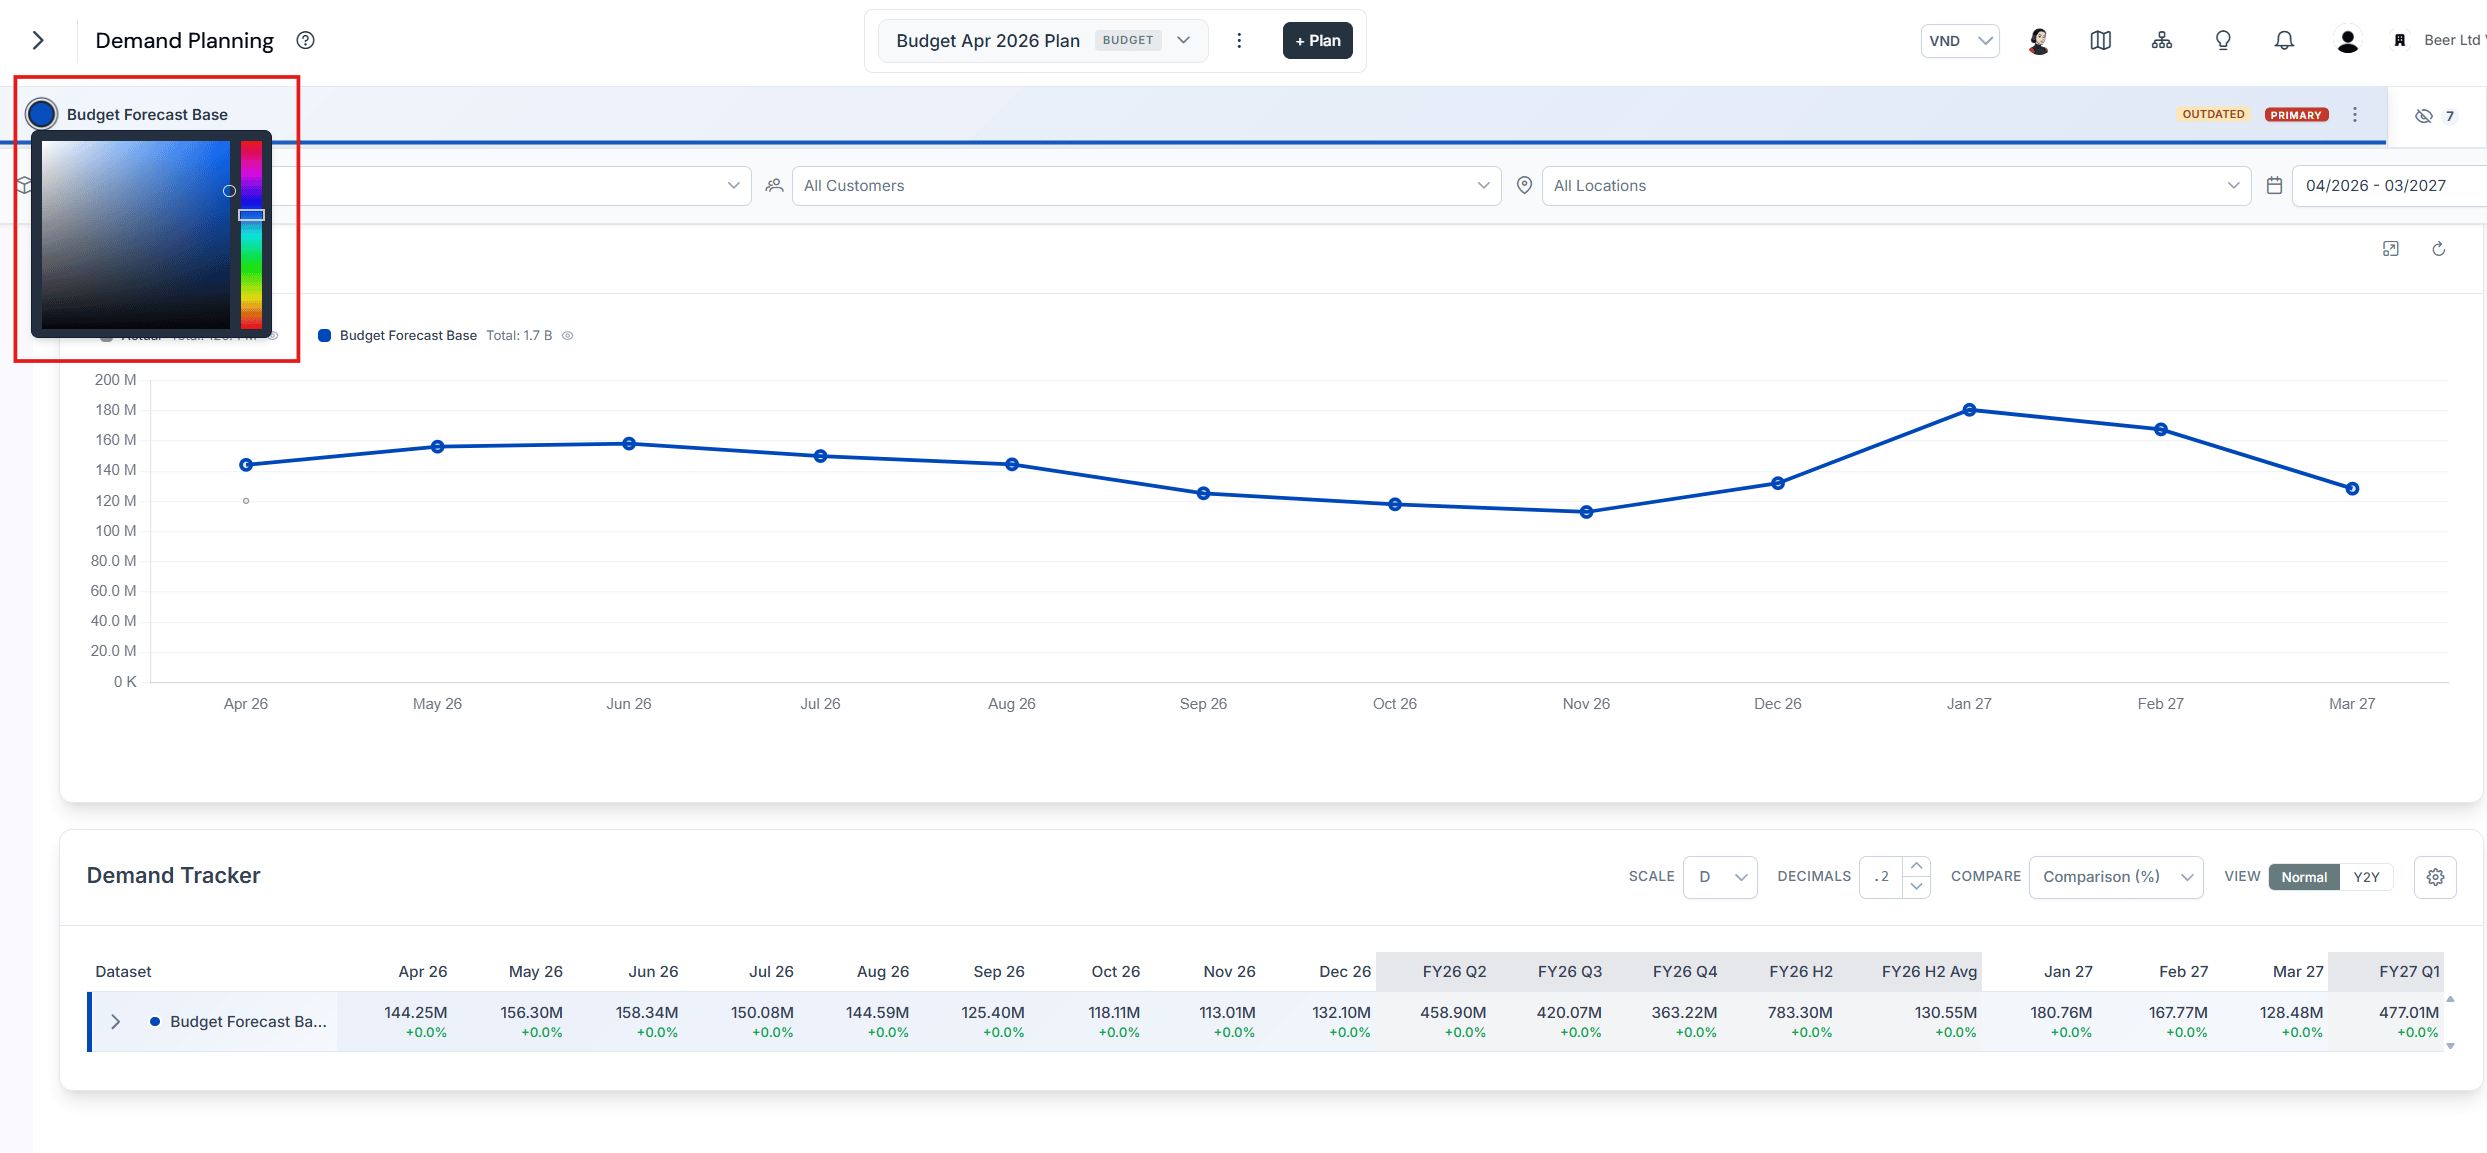
Choosing a color for a dataset
Analyze data with the demand table
Defining the segment hierarchy
To define and save the segment hierarchy used to display the demand breakdown, click the settings icon and go to the Select Segments tab.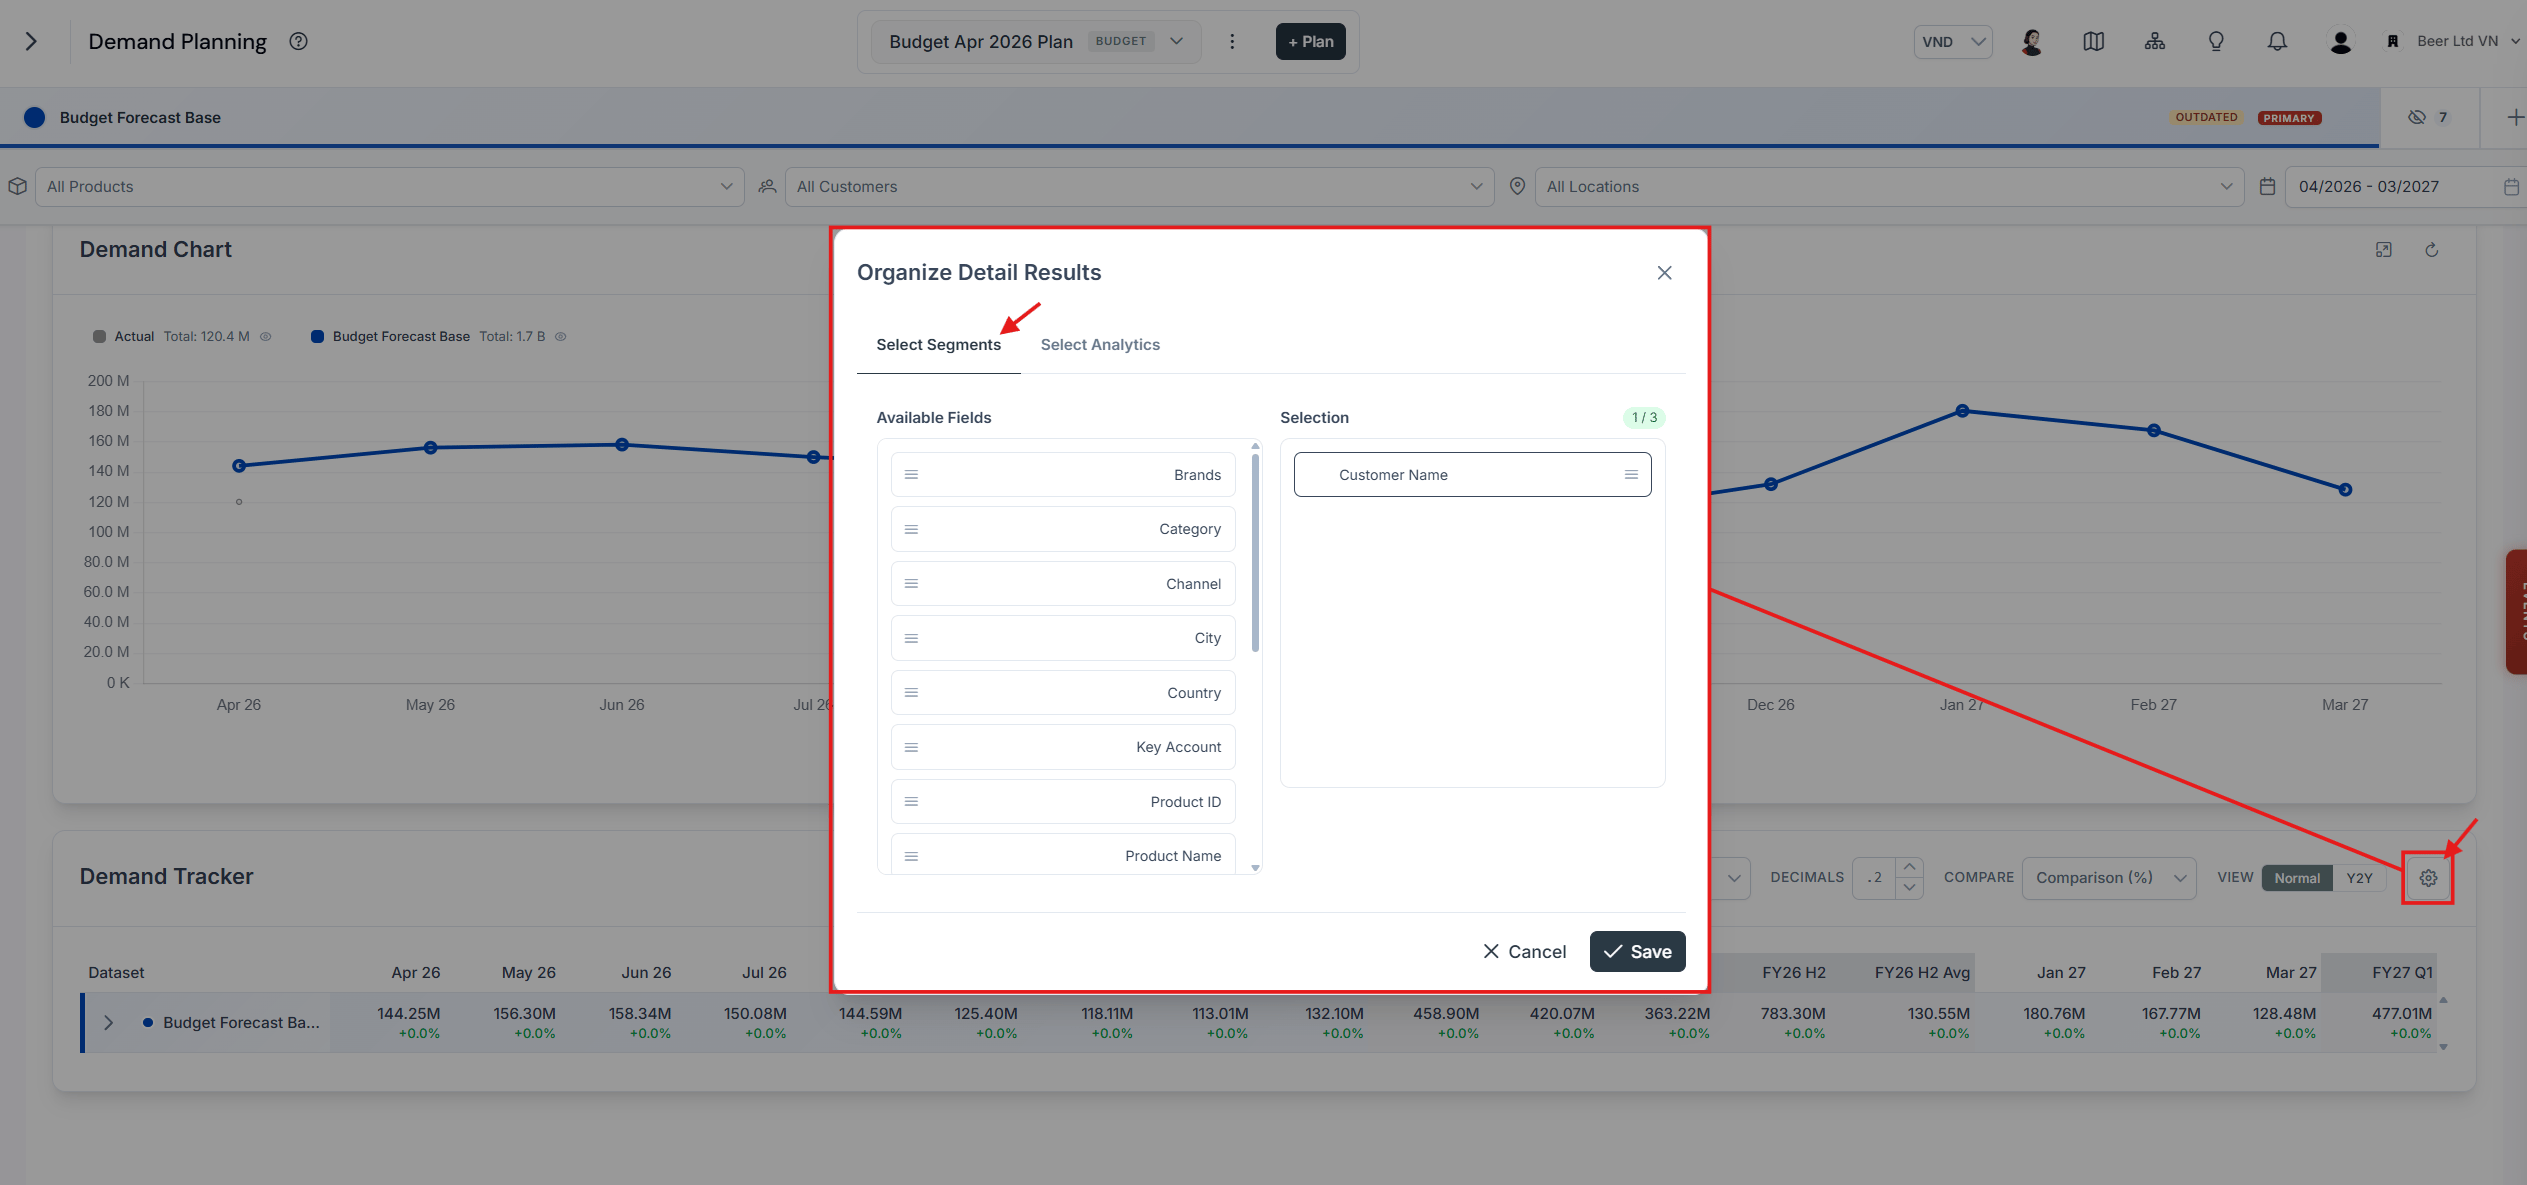
The Select Segments tab in the table settings
Adjusting the number scale
To adjust the number scale, click the letter in the upper right of the table and select Dynamic (D), Billion (B), Million (M), Thousand (K), or Unit (U):- Dynamic - Automatically formats to the first thousand. For example, 10,000,000,000 becomes 10B and 1,000,000 becomes 1M.
- Billion - Automatically formats to billions. For example, 10,000,000,000 becomes 10B and 1,000,000 becomes 0.001B.
- Million - Automatically formats to millions. For example, 10,000,000,000 becomes 10,000M and 1,000,000 becomes 1M.
- Thousand - Automatically formats to thousands. For example, 10,000,000,000 becomes 10,000,000K and 1,000,000 becomes 1,000K.
- Unit - Keeps the original figure. For example, 10,000,000,000 stays 10,000,000,000.
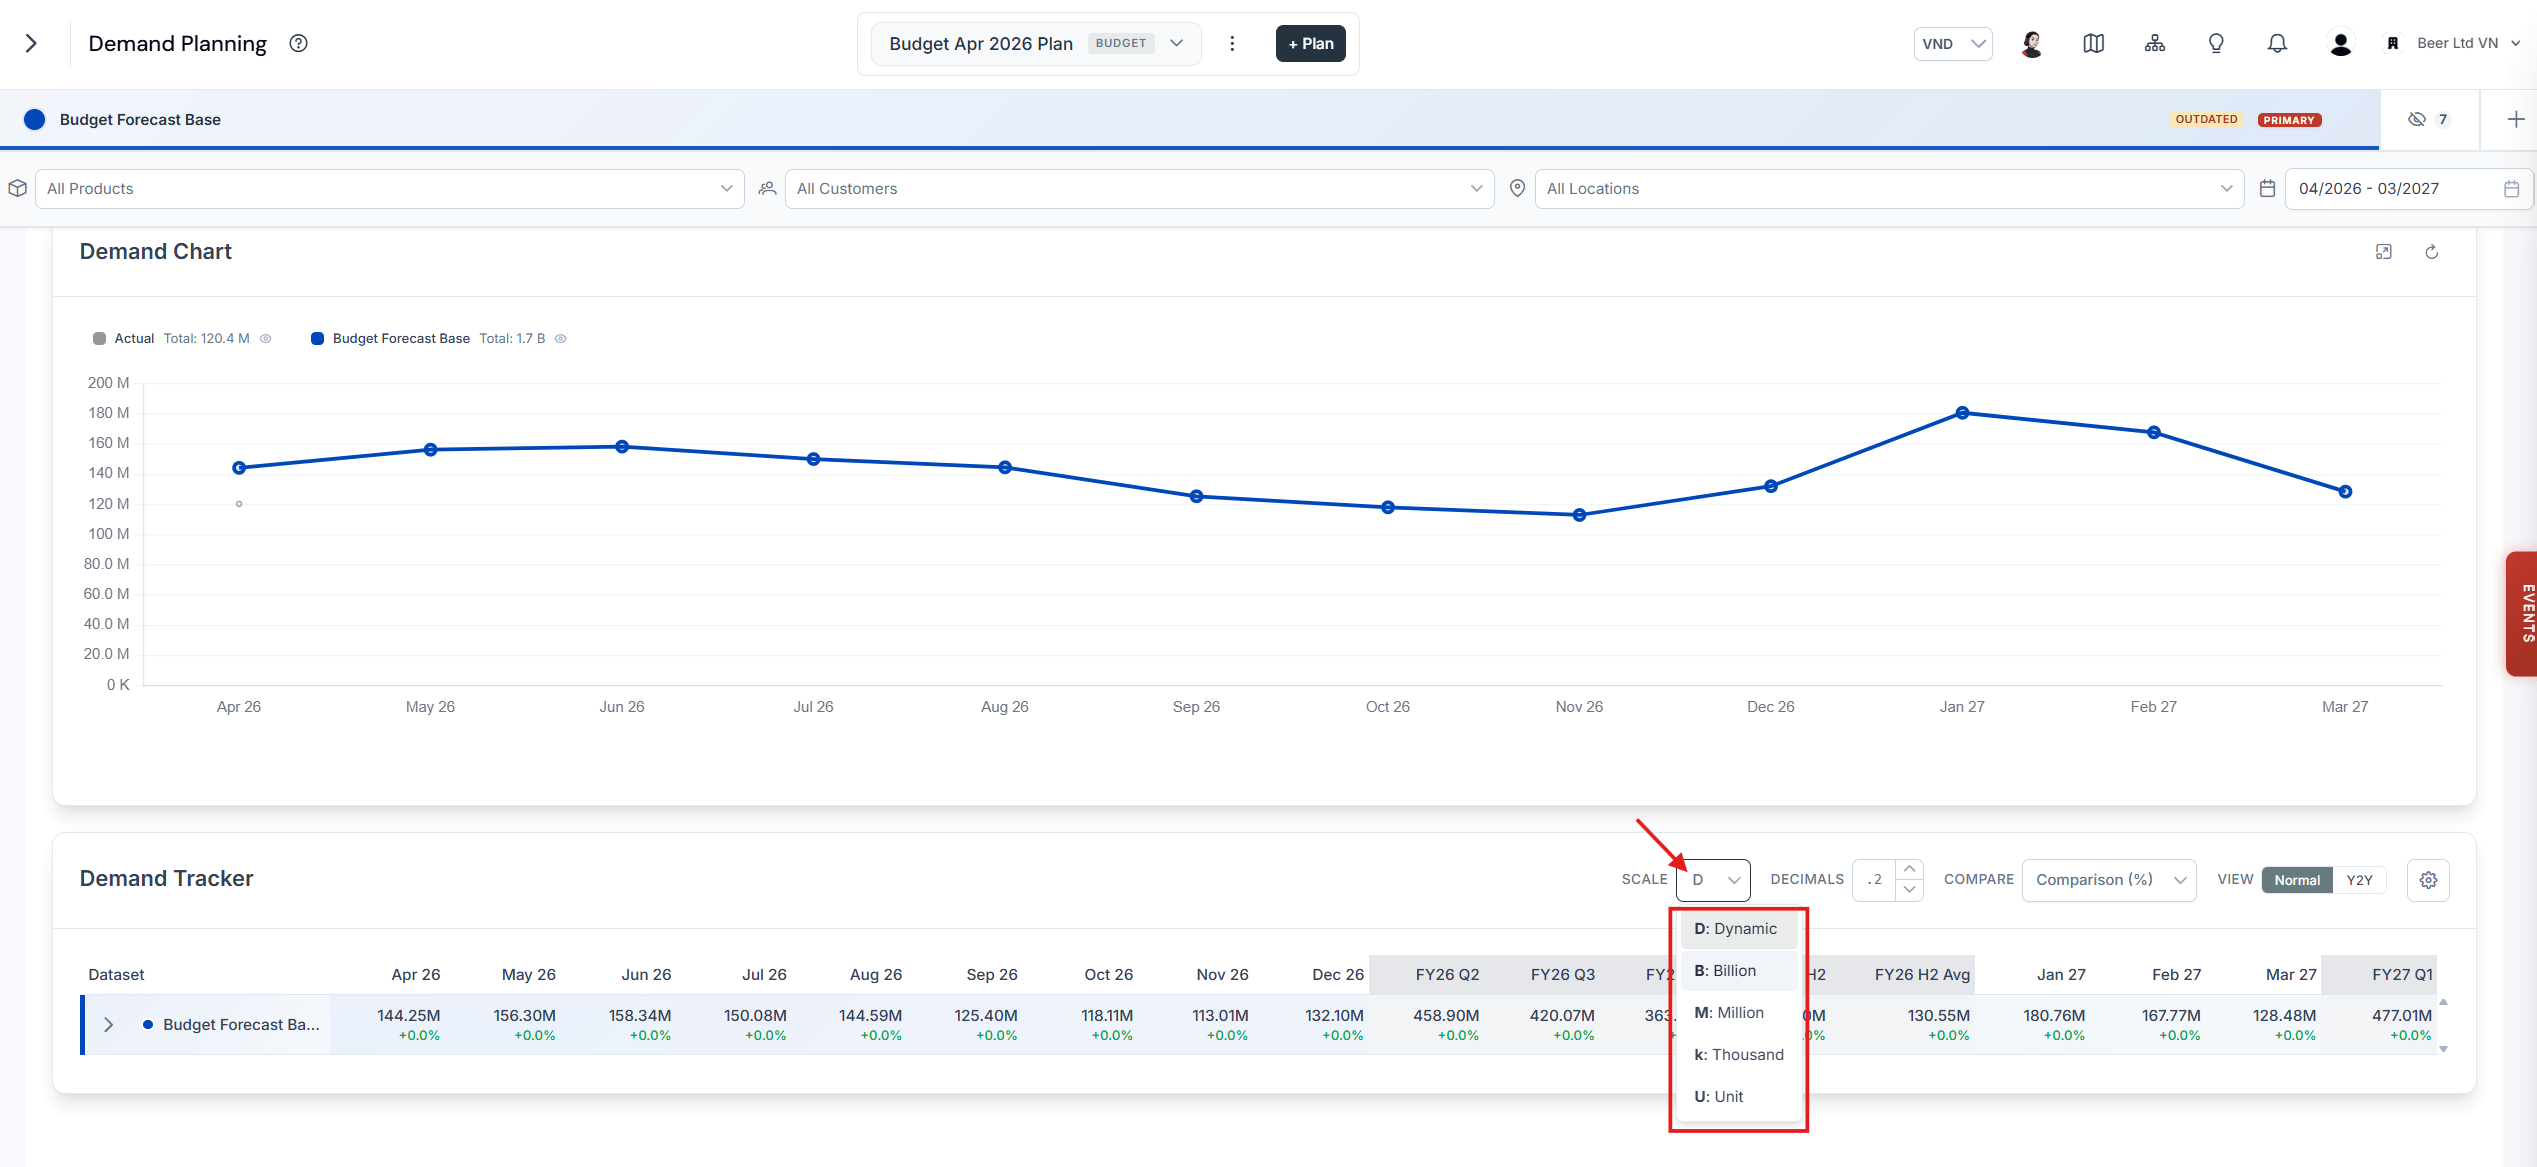
The number scale selector in the upper right of the table
Adjusting the number of decimals
You can adjust the number of decimals in the table by clicking add or remove decimals, or by setting the number of decimals directly in the upper right corner of the table.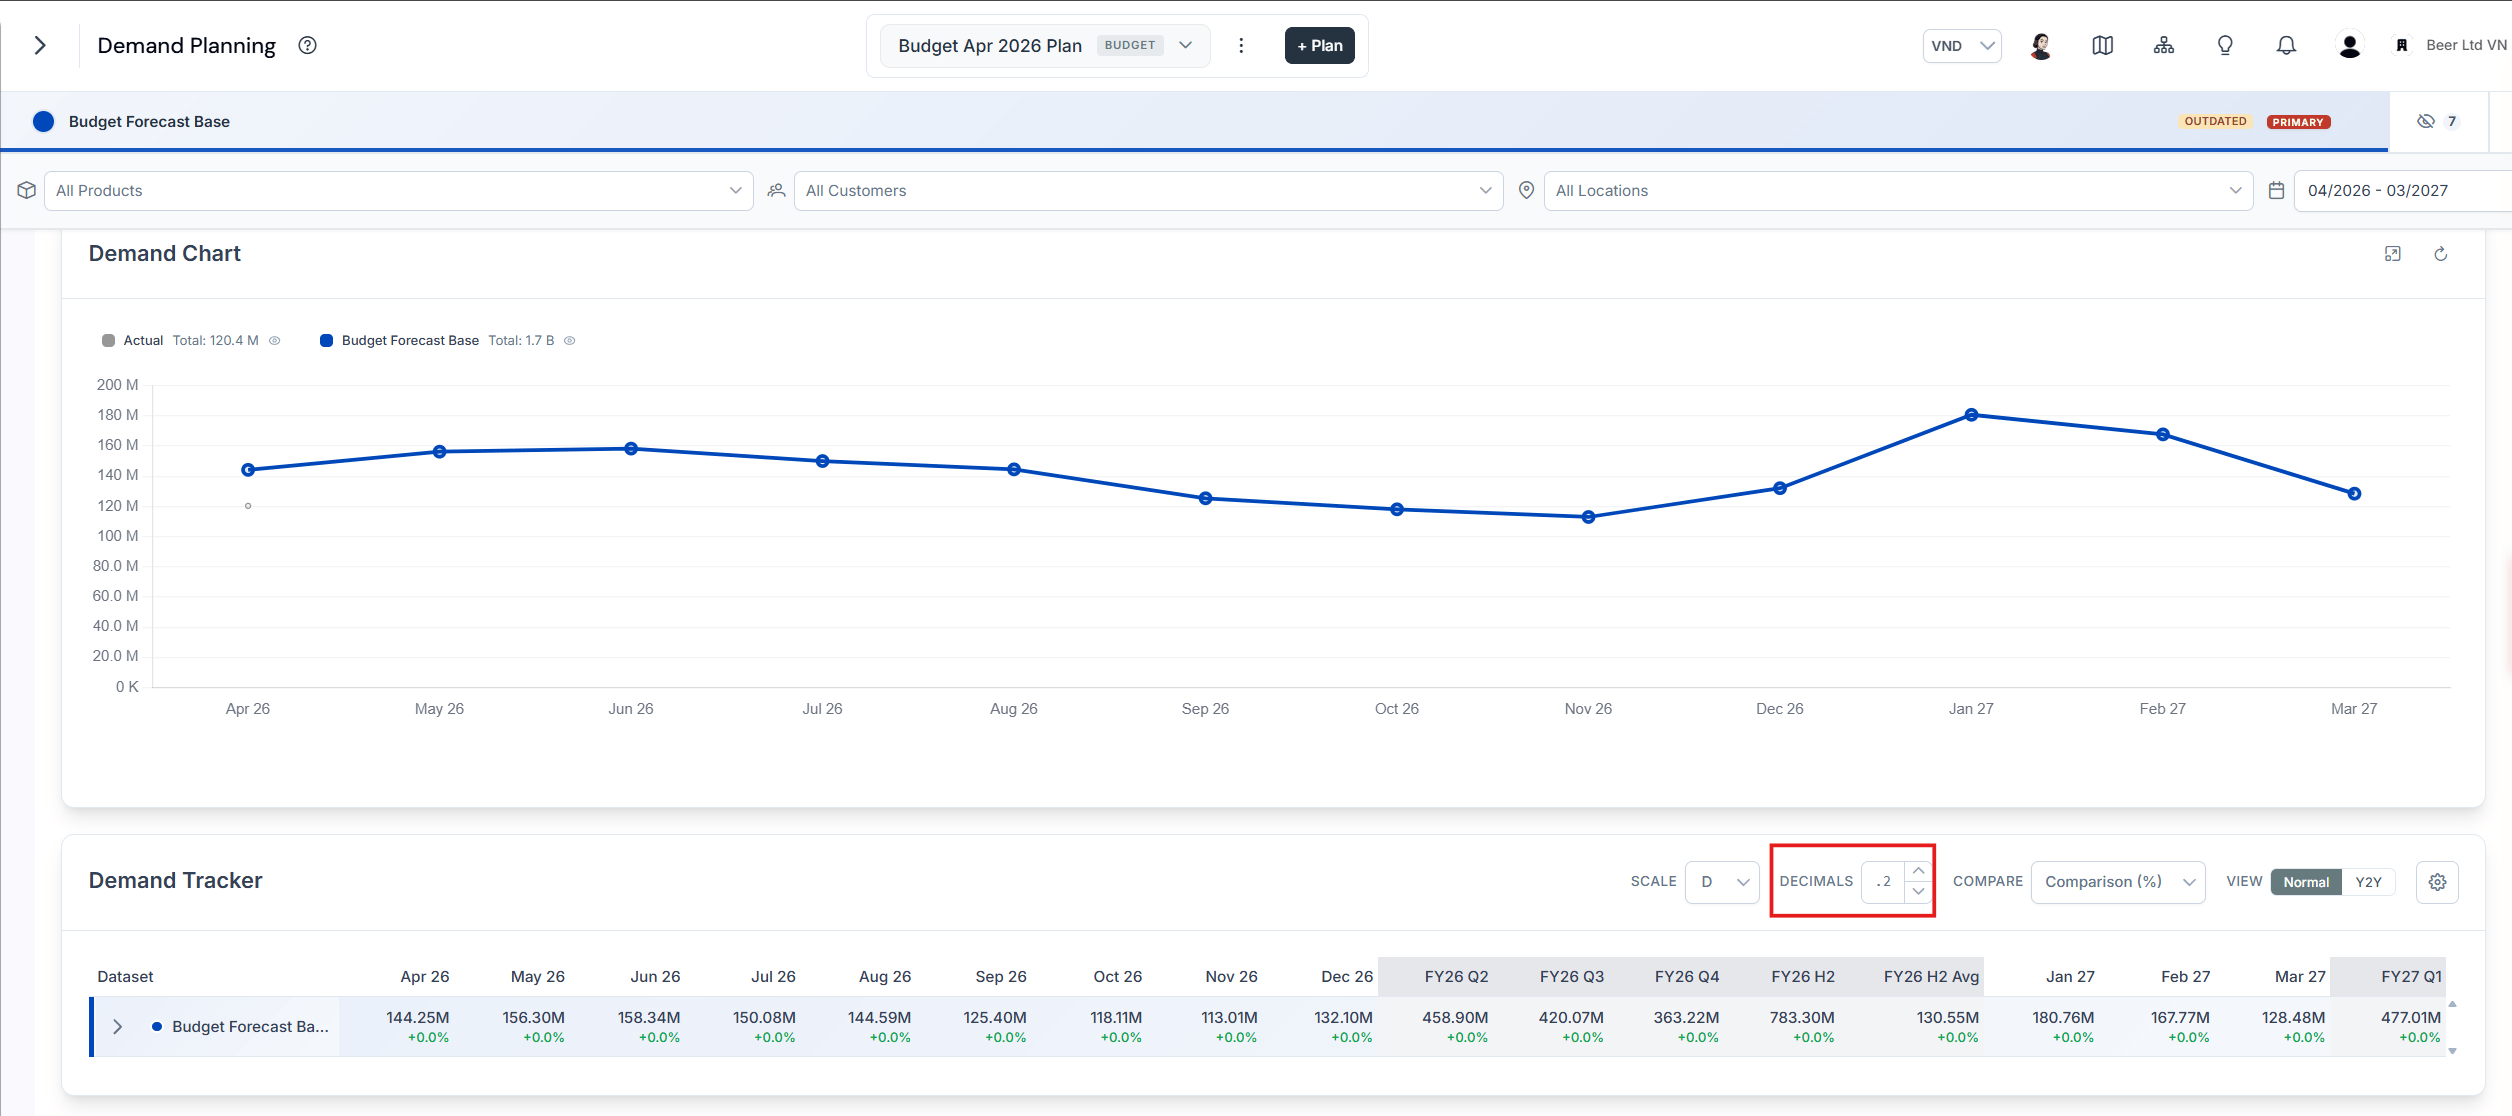
The decimal controls in the upper right corner of the table
Switching the table display to year-to-year
Switch the table display to year-to-year by clicking the Y2Y icon to compare demand values on an annual basis.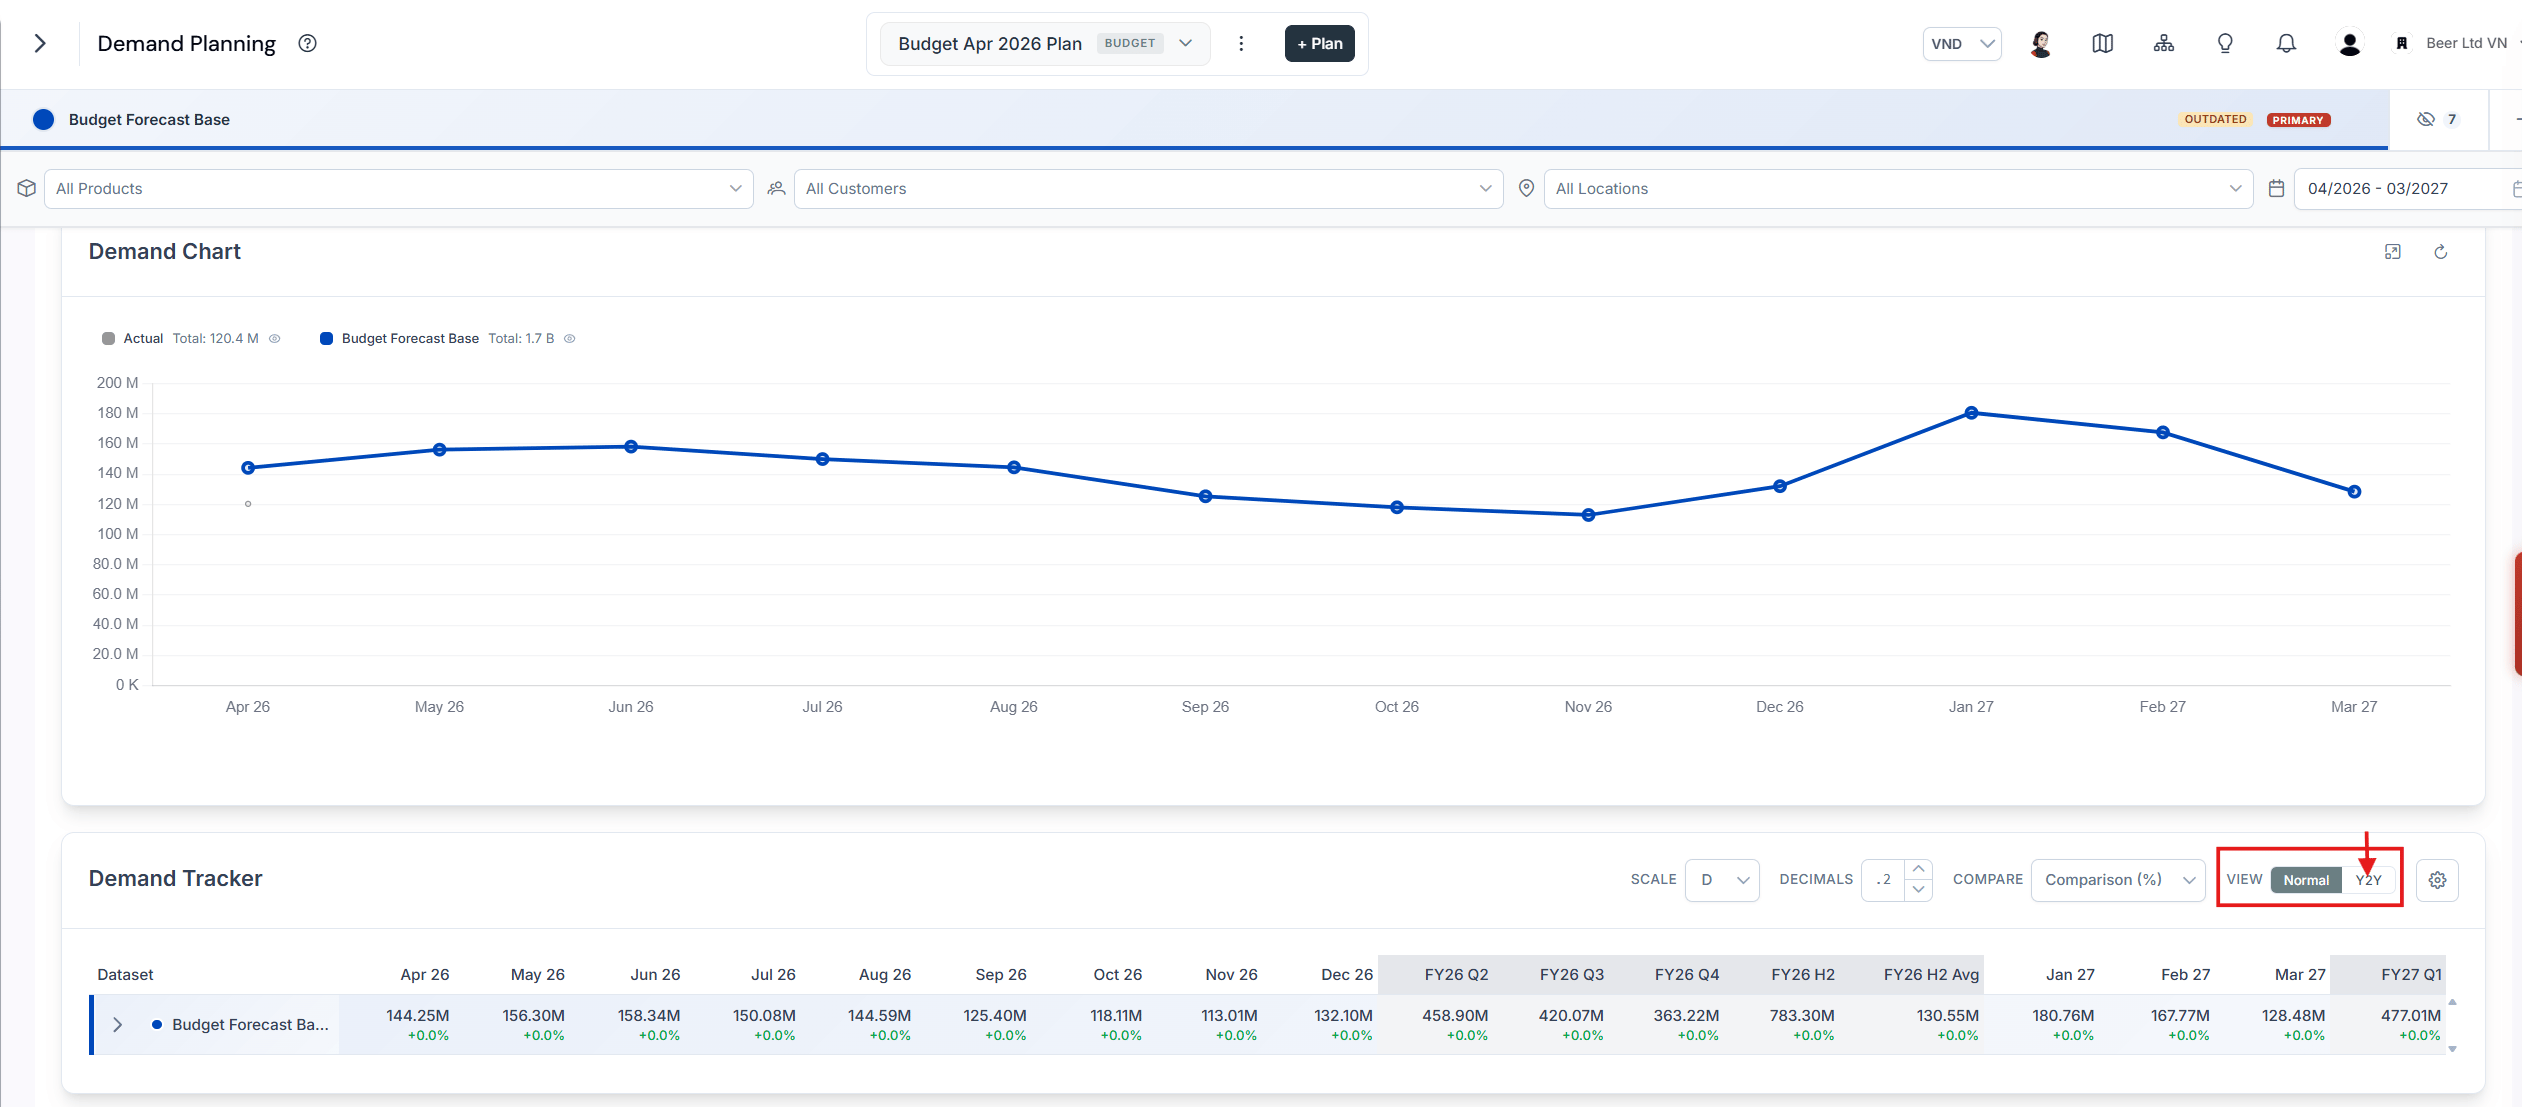
The Y2Y icon in the demand table toolbar

The demand table in year-to-year mode
Selecting the value comparison method
You can select how the value of a dataset is compared, so you can analyze the data according to different comparison metrics. Choose one of the following options in the dropdown:- Contribution - Displays the contribution to the total of the dataset.
- Growth (%) - Shows the value compared to last year as a percentage. It only displays when year-to-year mode is active.
- Growth (abs) - Shows the value compared to last year as an absolute value. It only displays when year-to-year mode is active.
- Comparison (%) - Displays the value compared against the highlighted scenario as a percentage.
- Comparison (abs) - Shows the value compared against the highlighted scenario as an absolute value.
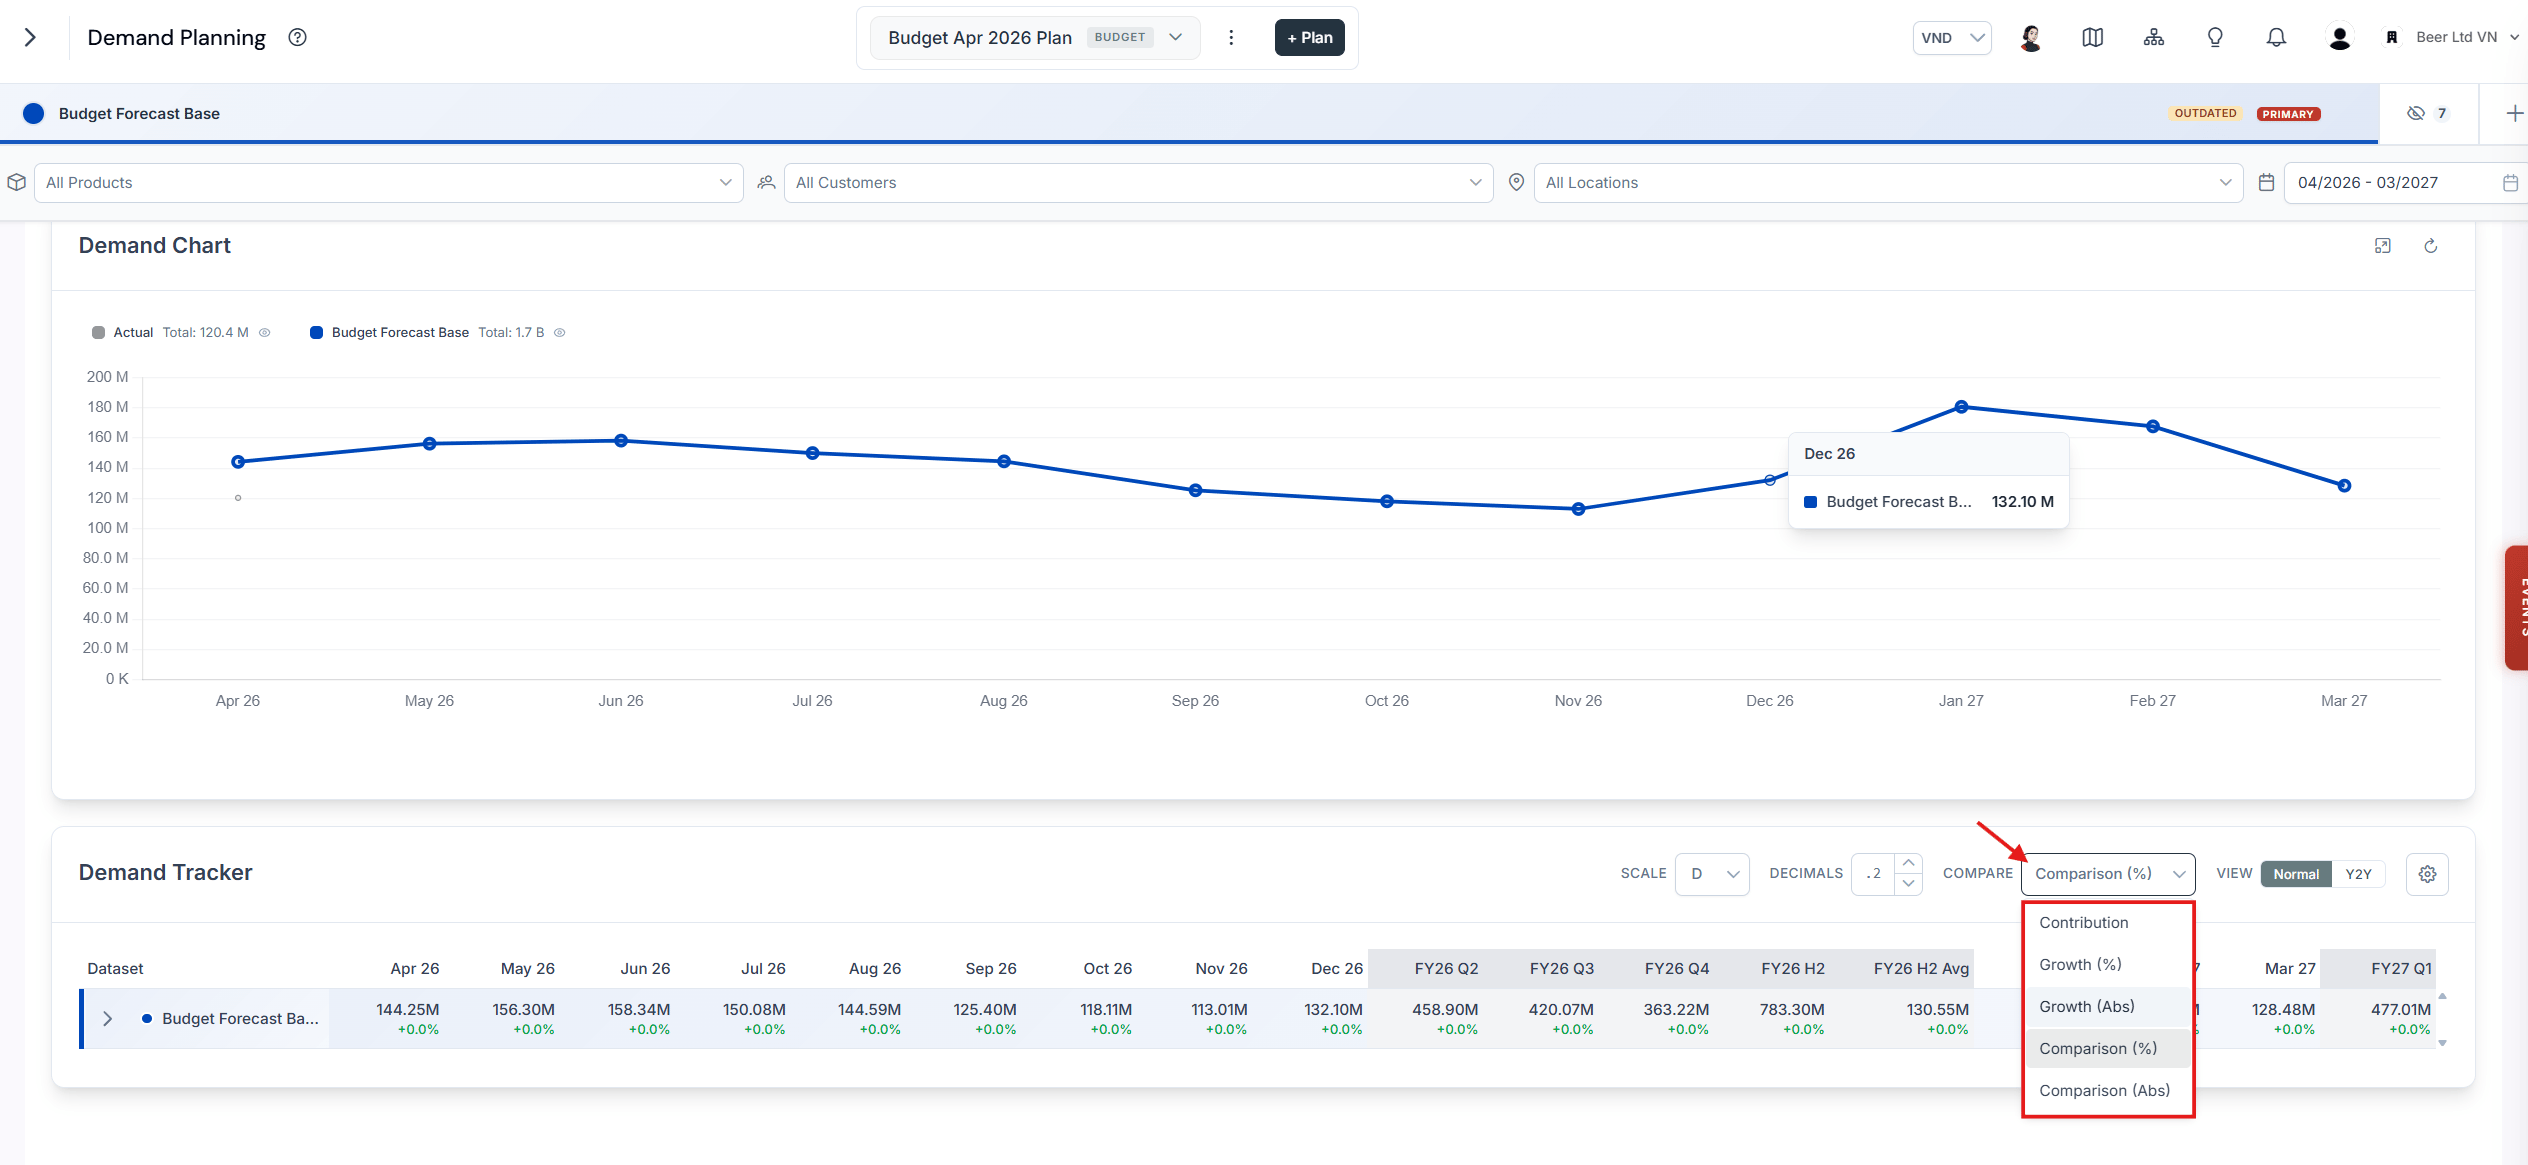
The value comparison method dropdown
Selecting actual periods for viewing average monthly demand
You can select the associated actual period to view the average monthly demand for the past 12 months (P12M), past 9 months (P9M), past 6 months (P6M), and past 3 months (P3M), so you can analyze trends and performance over different time frames.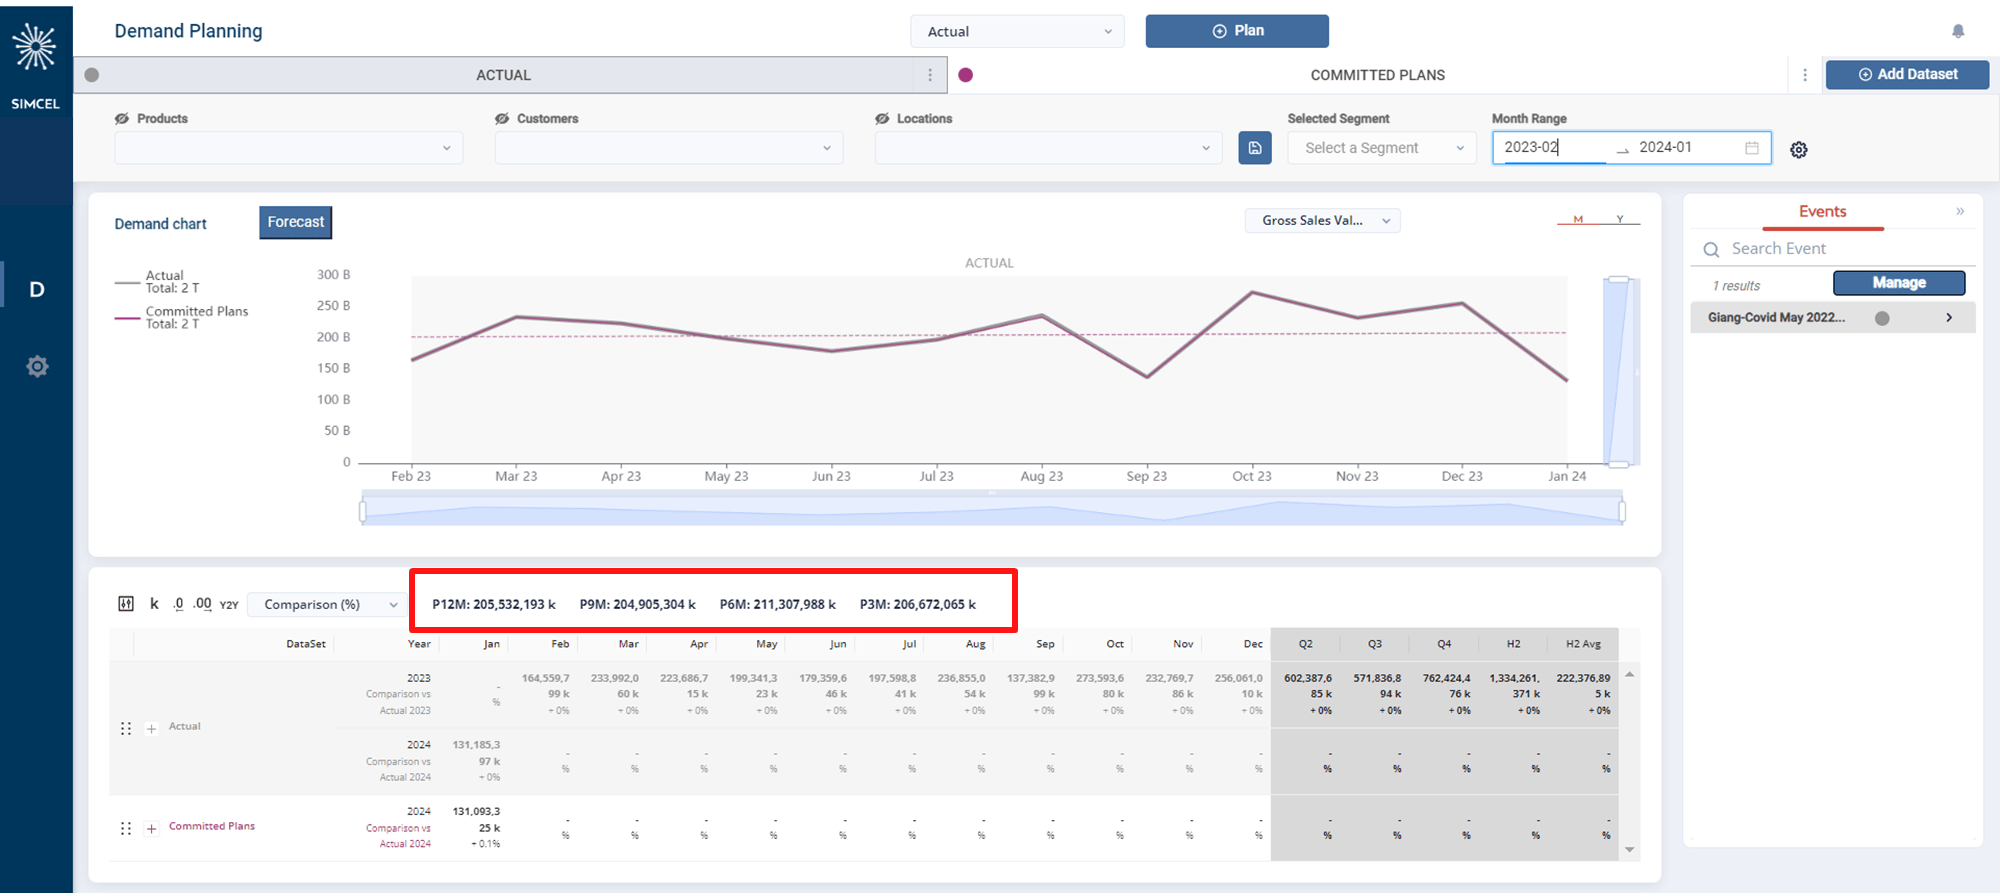
Selecting the actual period for the average monthly demand KPIs
The KPIs reflect monthly average actual sales performance over the last 12, 9, 6, or 3 months. This analysis only includes the most recent sales data within the chosen period.For instance, if sales data is available from October 2021 to January 2024 but you filter for May 2024 to April 2025, the run rates show as N/A, because there is no data in the future period.
Customizing the analytics display through settings
Use the settings icon to select which analytics metrics are displayed and in which order, so you can tailor the analytics view to your needs. The metric formulas are provided in the appendix.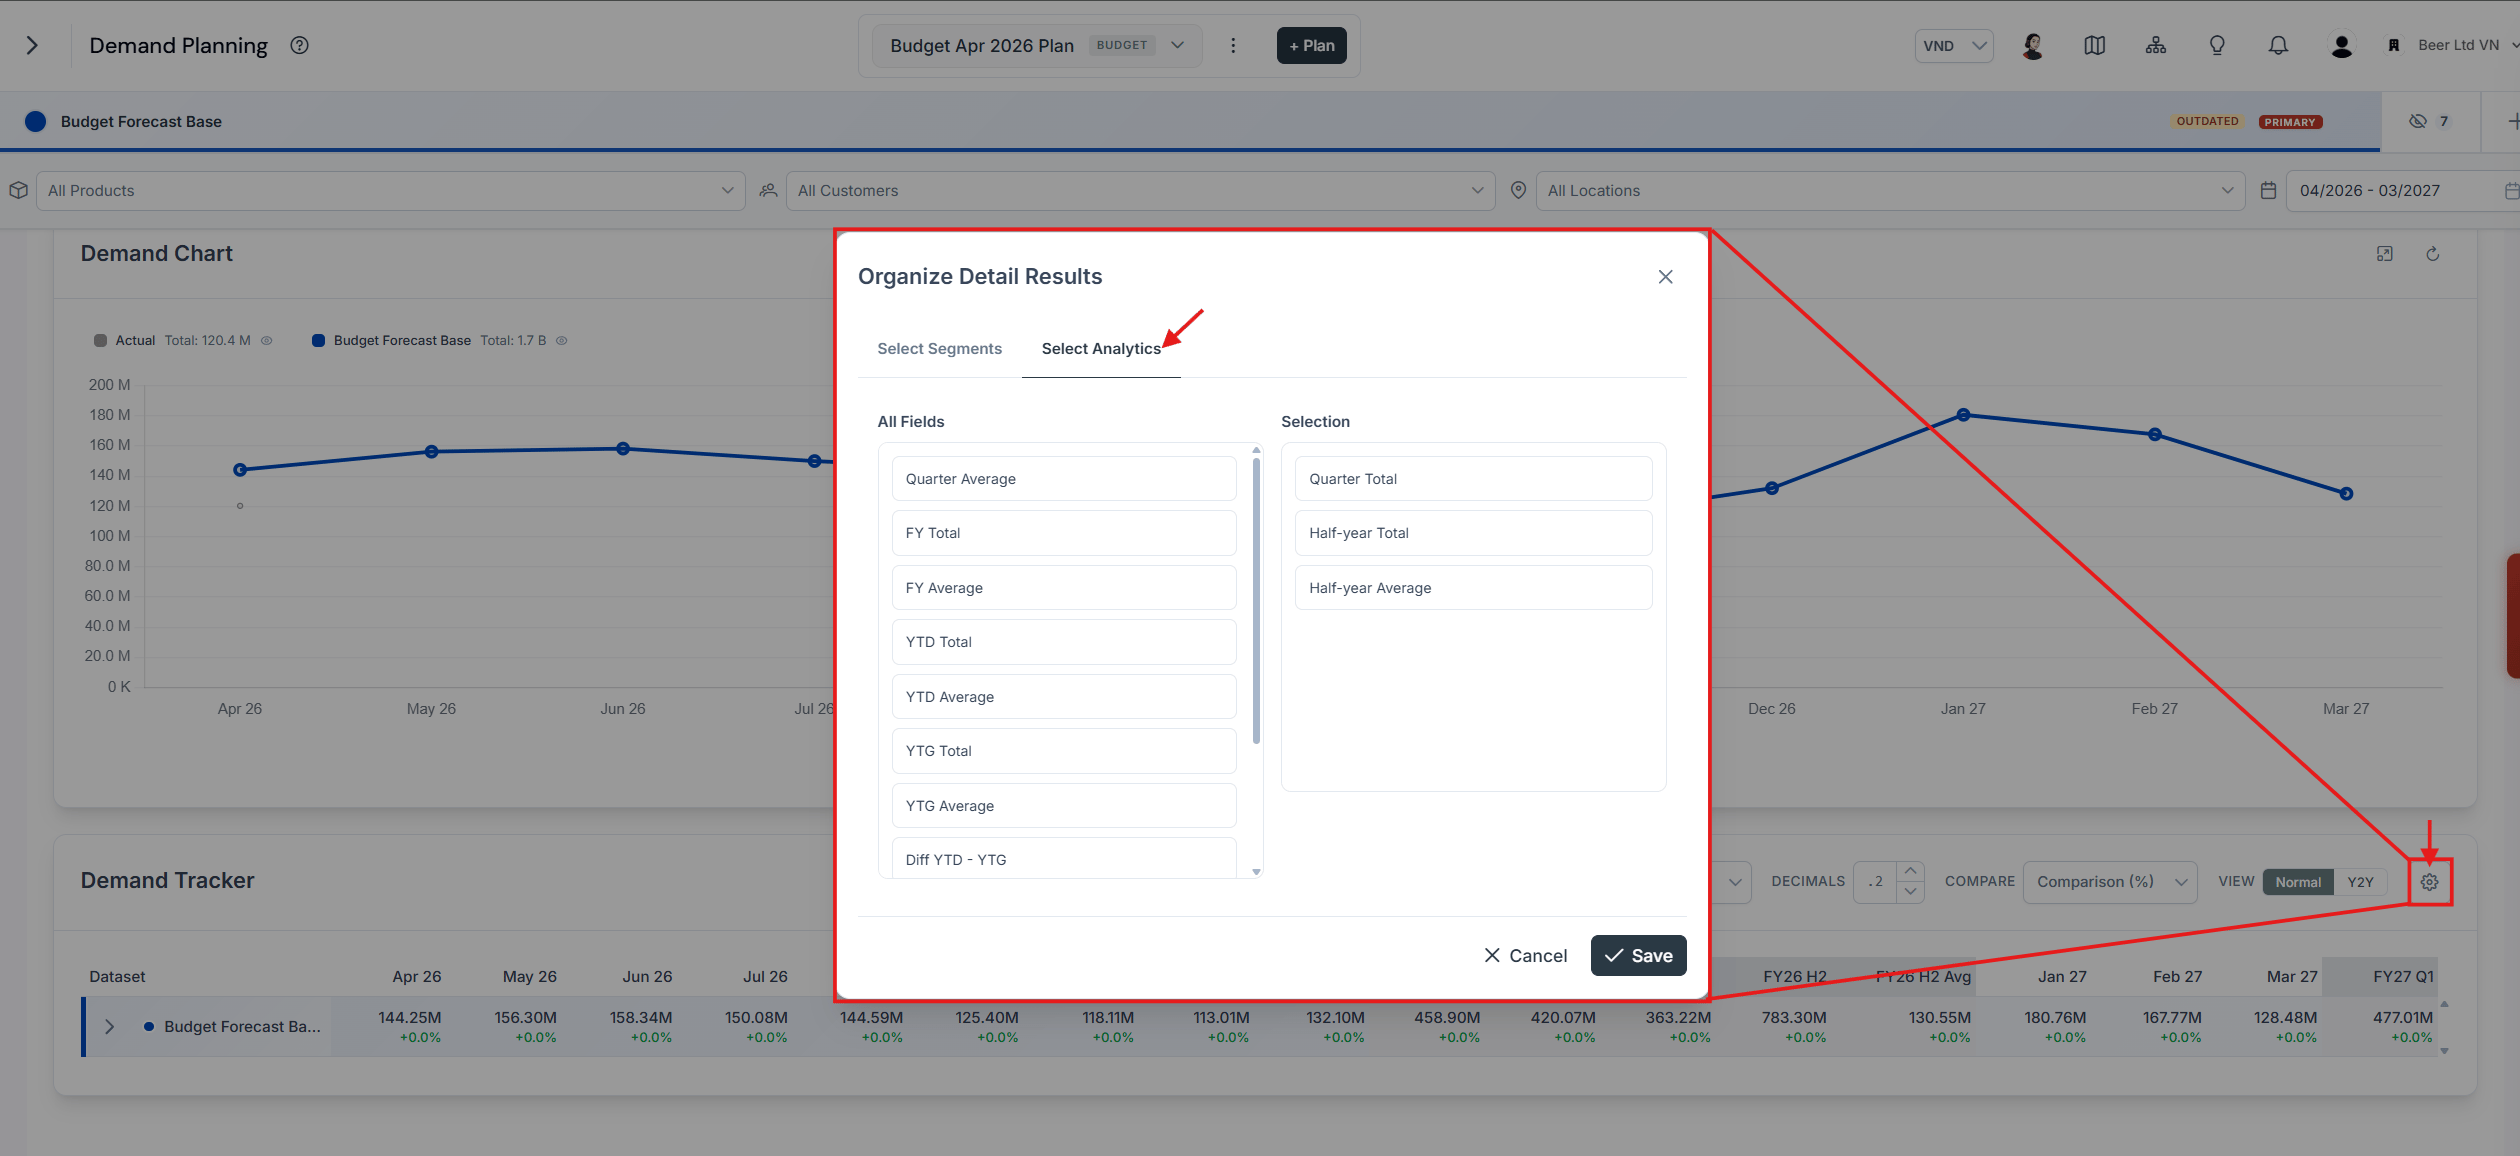
Choosing which analytics metrics are displayed and in what order
Apply page filters
Month range filter
Select the period you want to focus on.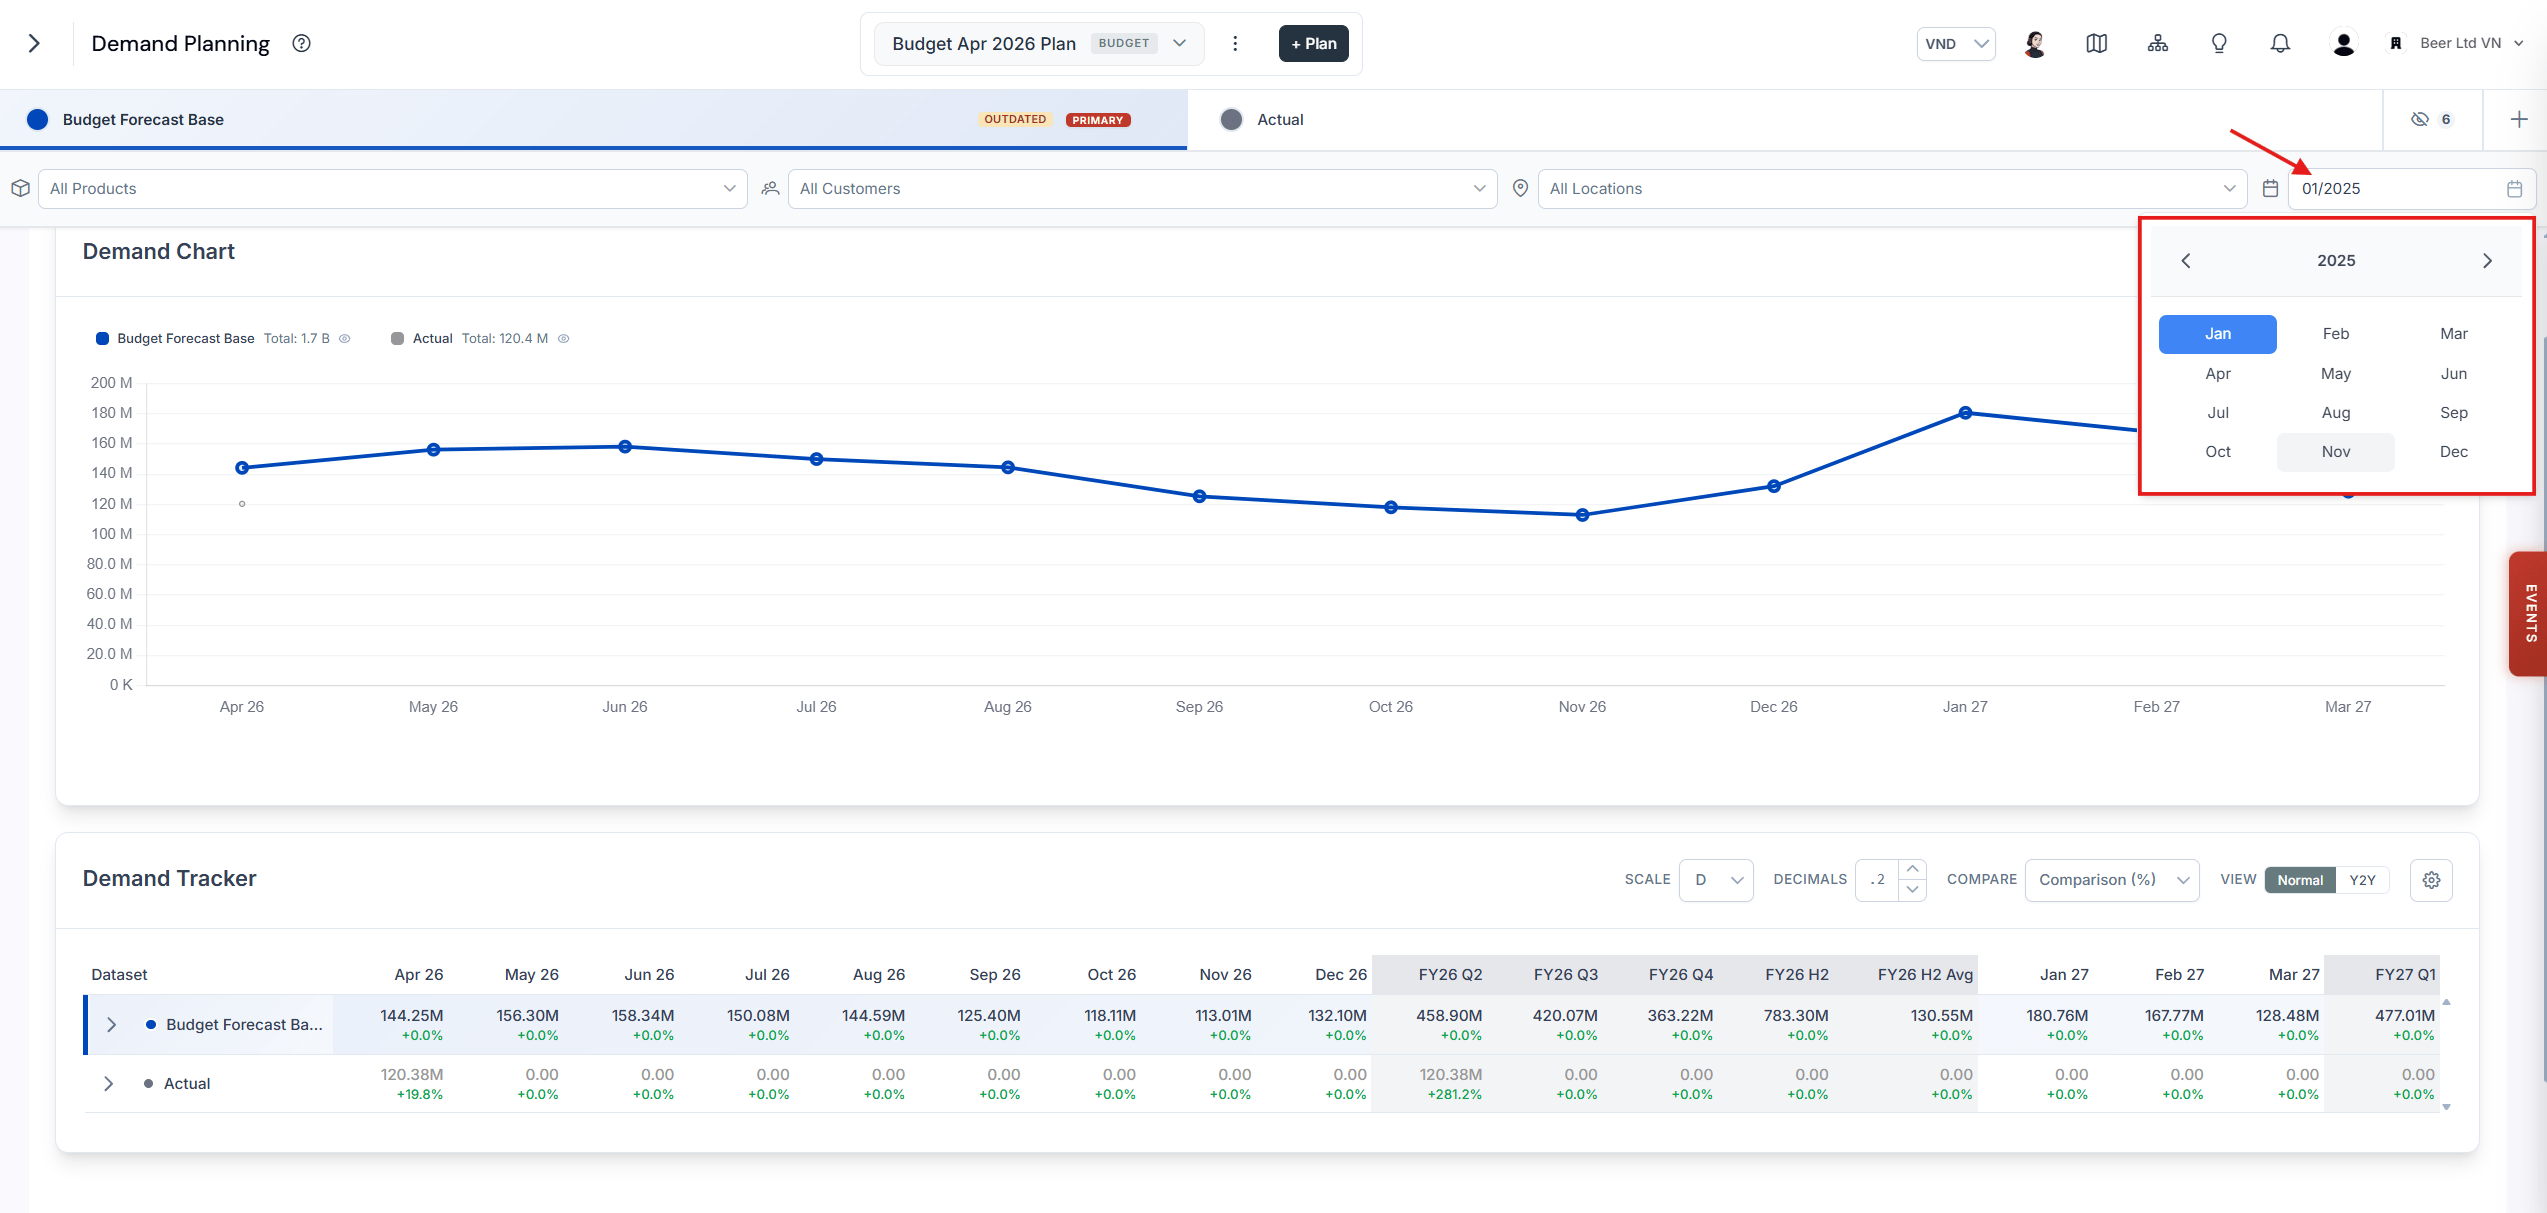
The month range filter
Segment filters
Select the segments you want to focus on.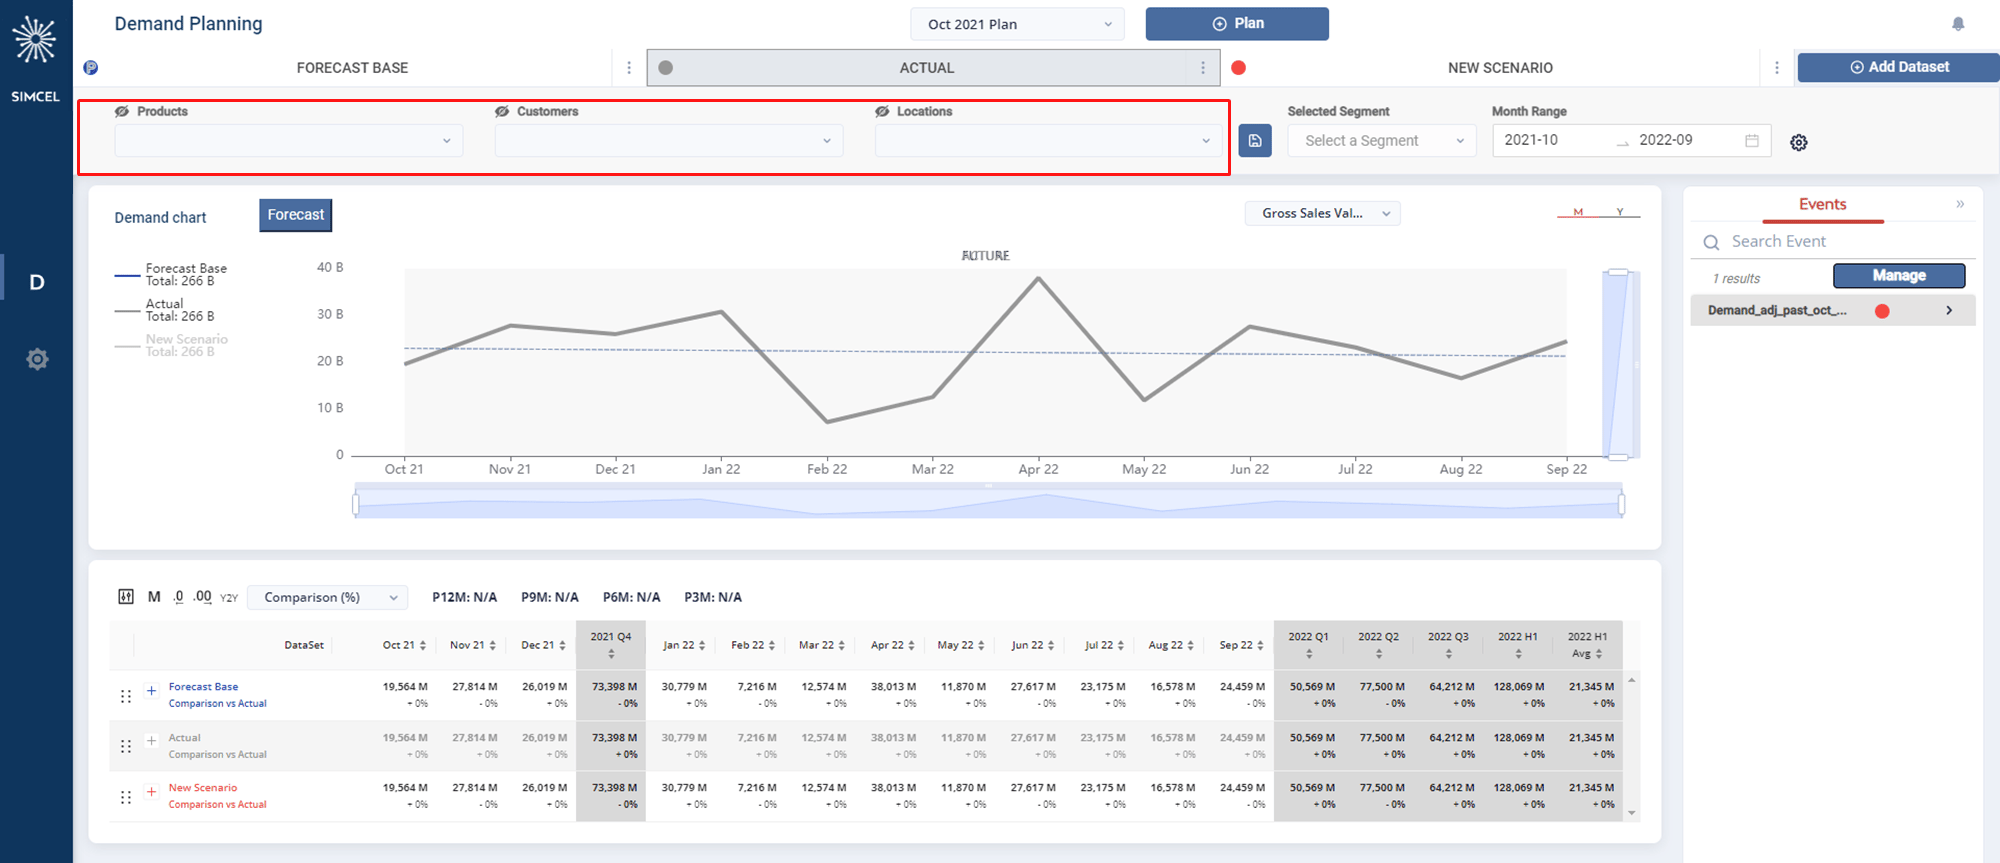
The segment filters
Creating saved segments
The Saved Segment feature lets you save a combination of filters, such as customer, product, and location, for easy retrieval in future analysis. This helps you concentrate on the aspects that are most important to you or your business, and makes navigation easier.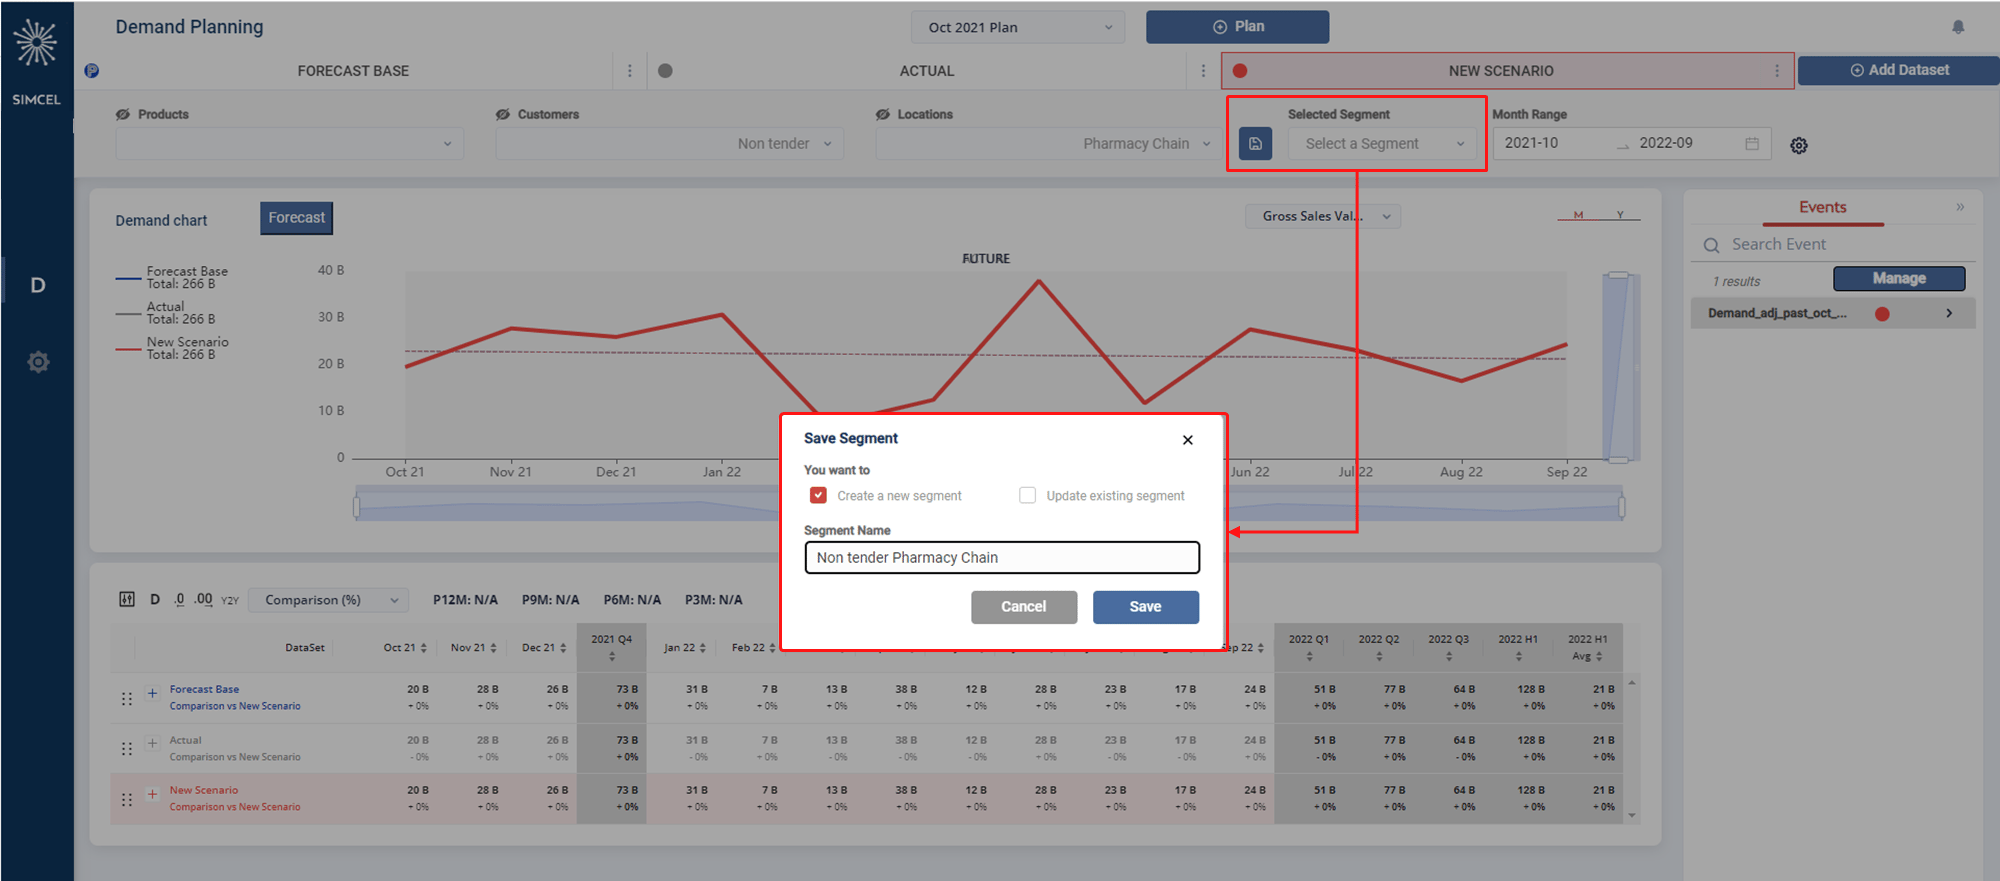
Saving a combination of filters as a segment
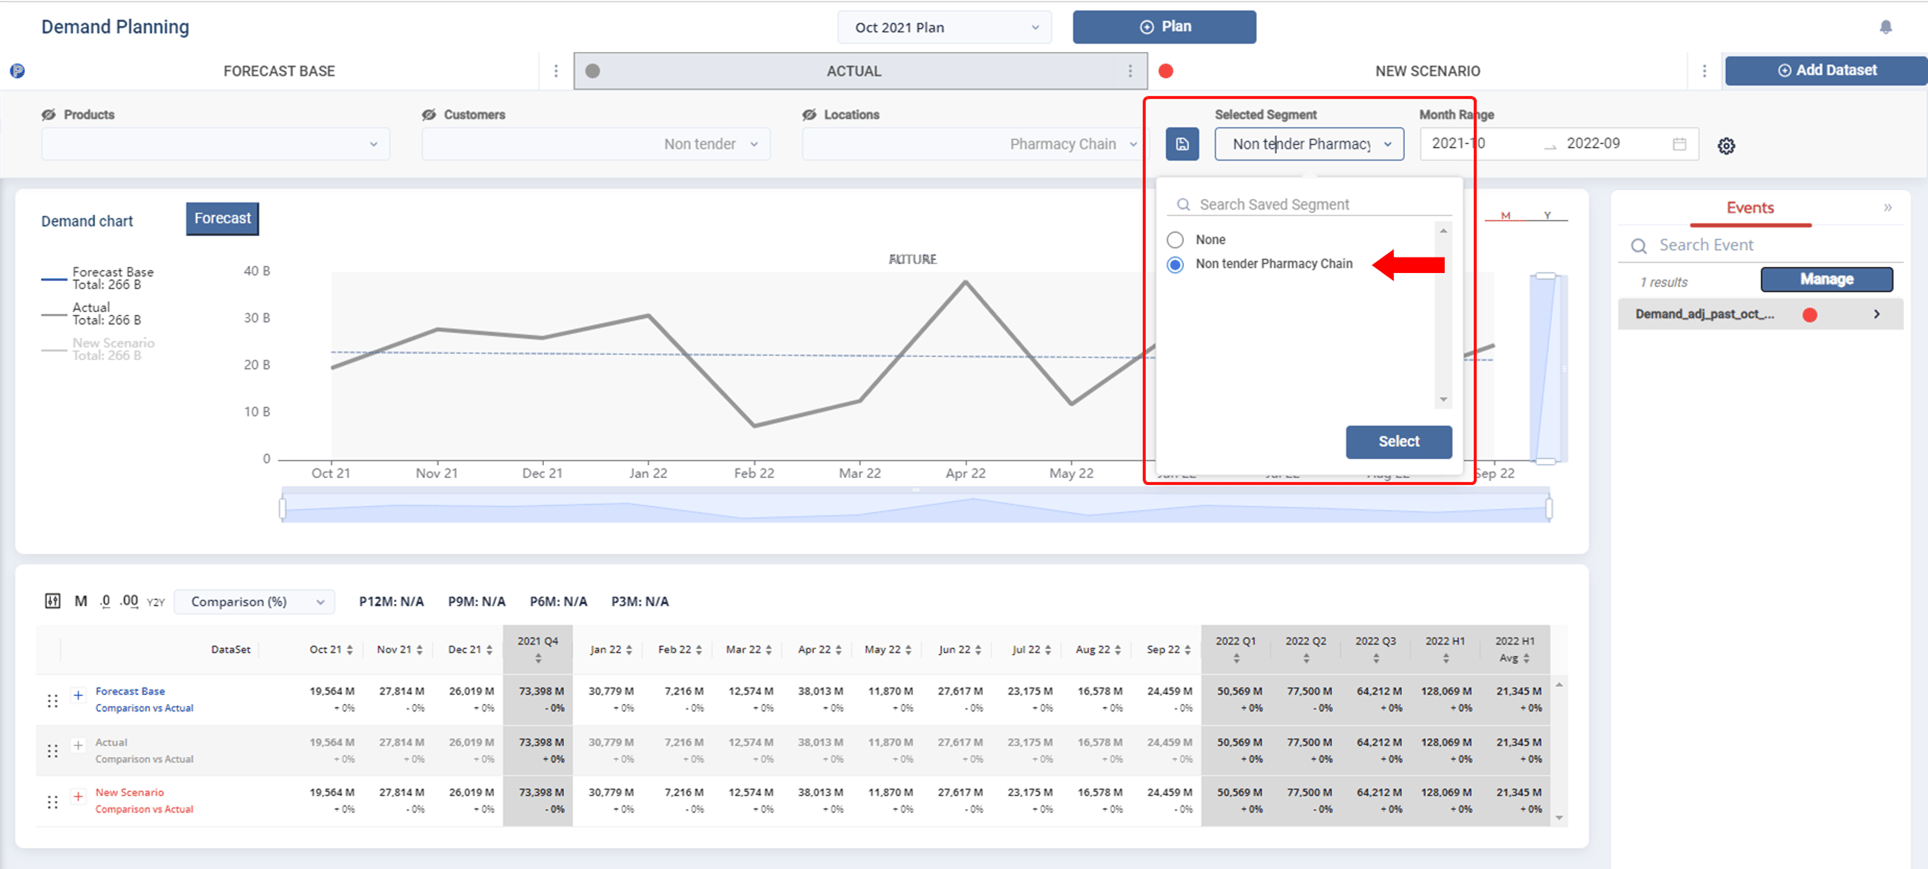
Retrieving a saved segment from the dropdown
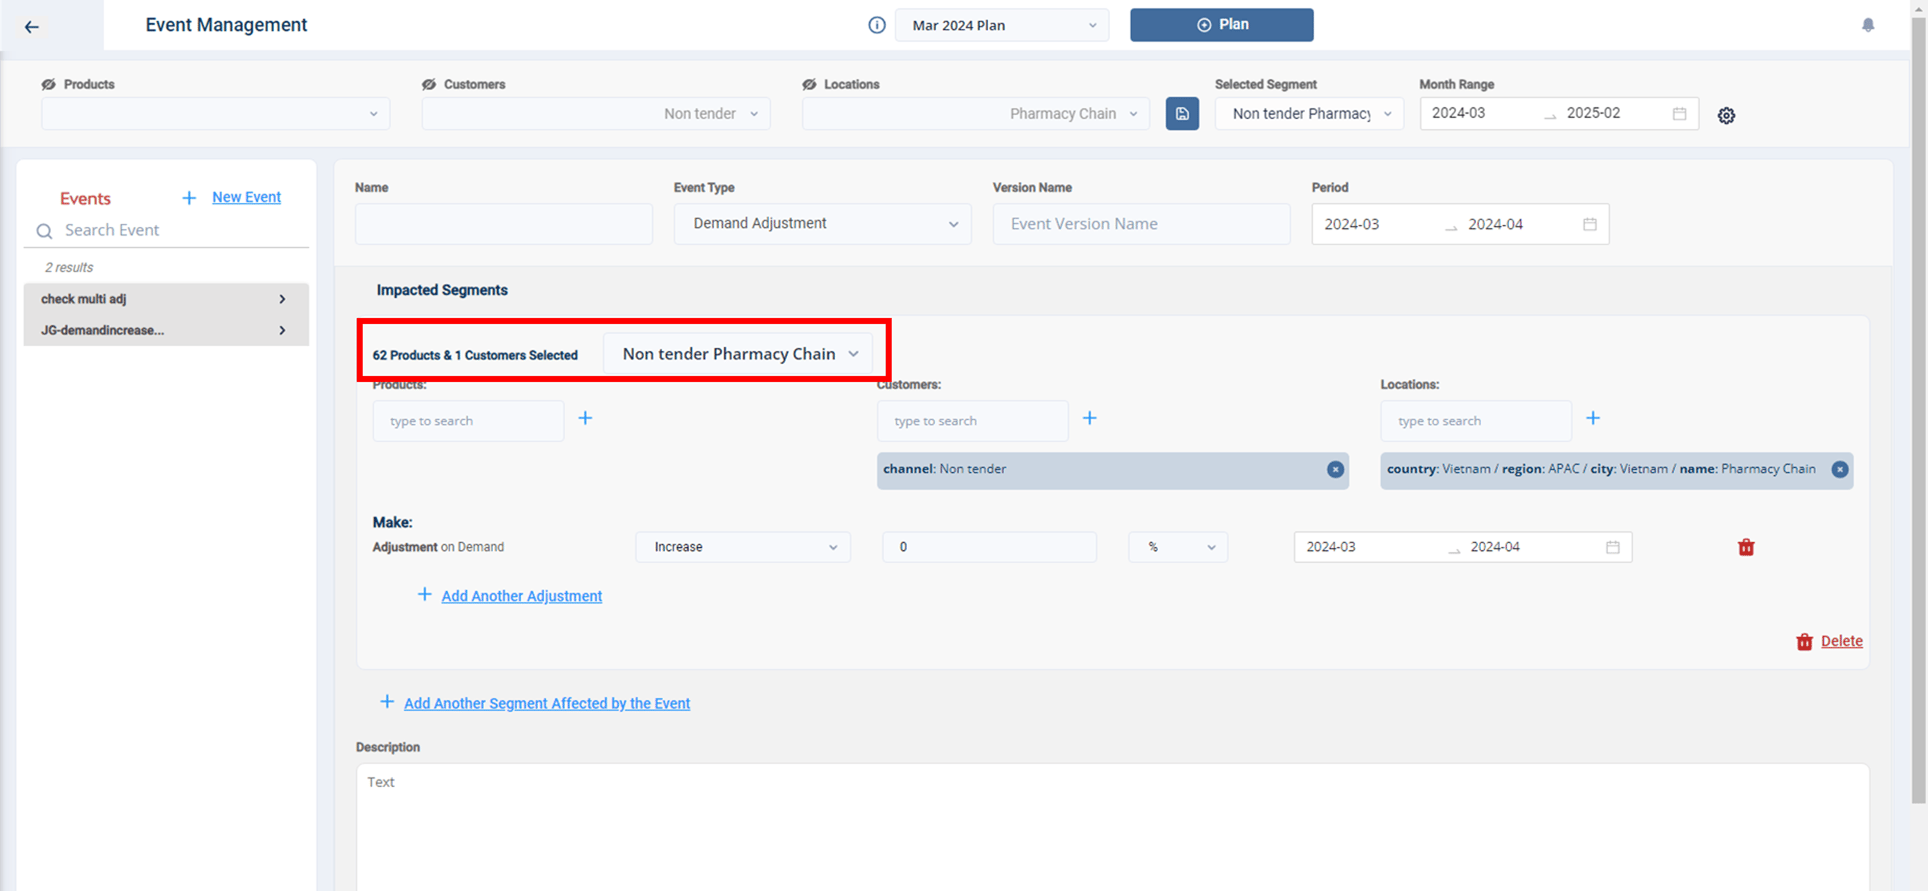
Applying a saved segment while creating an event