Accessing the forecast settings

Click + Plan to open the SIMCEL plan menu.
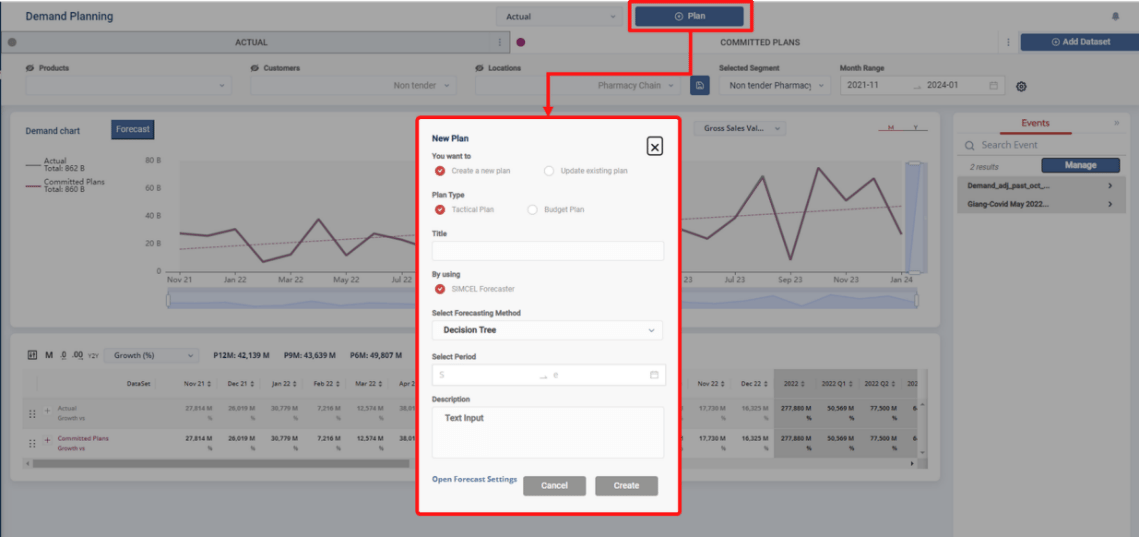
SIMCEL toolbar with the + Plan button highlighted, opening the plan creation menu

The + Plan button opens the SIMCEL plan menu
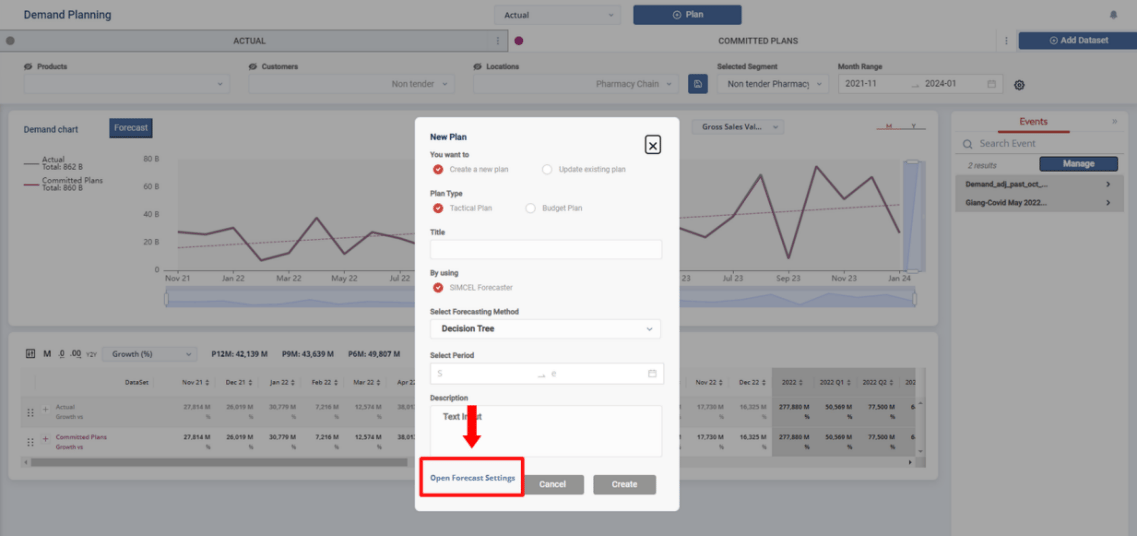
To open the forecast settings, click Open Forecast Settings at the bottom of the pop-up.
Plan creation pop-up with the Open Forecast Settings button at the bottom

The Open Forecast Settings button at the bottom of the plan pop-up

This screen gives you access to the different settings for the forecaster in SIMCEL.

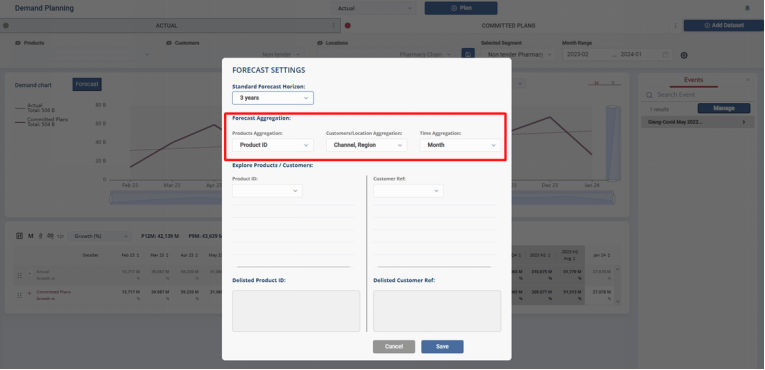
Forecast aggregation

Forecast Aggregation settings with granularity selectors for the Product, Customer/Location, and Time dimensions

The Forecast Aggregation settings

Forecast aggregation is the granularity at which forecasts are generated. Choosing it involves a strategic balance between data detail, forecast precision, accuracy, and computational efficiency. As a rule of thumb:
  • Higher levels of data aggregation speed up the forecasting process, because the data representation is denser. However, this often comes at the cost of reduced precision, as nuances and specific patterns may be lost.
  • Finer data granularity enhances the detail level of the forecast, potentially increasing precision. This detailed approach requires more computational resources, because the data volume is larger and more complex to analyze.
Accurate forecasting requires identifying the ideal level of data granularity. Excessively aggregated data can obscure vital trends and patterns, diminishing precision and utility. Overly detailed data can create discontinuities in the forecast model, with insufficient data points in each segment to discern trends and patterns. The goal is to strike a balance that preserves critical information while ensuring computational feasibility and forecast reliability. SIMCEL lets you select the granularity of 3 dimensions: Product, Customer/Location, and Time.

Explore products and customers

This feature lets you efficiently review the actual demand for the selected product or customer over the most recent year. Sometimes a customer or product is removed from the active list but its status is not updated in the master records. Use this feature to quickly visualize their historical demand and decide whether they should be delisted.
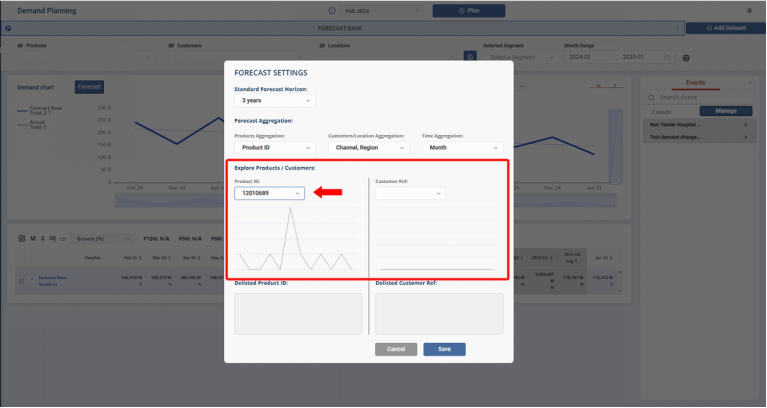
Explore Products/Customers panel showing the last year of actual demand for the selected product or customer

Reviewing recent actual demand for a selected product or customer